Create a Custom Metric in Zabbix
In our recent blog post, we have covered installation of Zabbix Server, and agent, and how to configure a host for monitoring. Today we are going to dive into how to create a custom metric in Zabbix. Finally, we’ll create a custom metric for monitoring Nginx server.
![]()
So, let’s get started.
Assuming that you have already configured Zabbix Server and Zabbix agent(in Nginx server). If not, please follow our previous blog on Zabbix.
To configure custom metric, Zabbix provides something called userparameter. This userparameter is defined in the Zabbix agent configuration file.
Syntax of UserParameter is as follows:
[js]
UserParameter=<key>,<command>
[/js]
In the above syntax, the key is the item key used to retrieve data from Zabbix agent and output generated by the command is the data retrieved from Zabbix agent. Note that default item key provided by Zabbix server cannot be used in userparameter.
So, let’s start with Nginx monitoring.
Basic status information about Nginx can be accessed via stub module provided by Nginx. We will use this module to monitor our Nginx server.
Nginx must be compiled with http-stub module. Nginx installed using apt-get by default contains http-stub module. To check if Nginx contains stub module, run the following command:
[js]
nginx -V 2>&1 | grep -o with-http_stub_status_module
[/js]
We will need to add the following configuration at Nginx site:
[js]
location /nginx_status
{
stub_status on;
access_log off;
allow 127.0.0.1;
deny all;
}
[/js]
After adding the following configuration, restart Nginx. Now, that we have stub module enabled, basic information about Nginx can be accessed on visiting localhost/nginx_status from the same server:
[js]
curl localhost/nginx_status
Active connections: 32
server accepts handled requests
54 54 83
Reading: 6 Writing: 2 Waiting: 12
[/js]
Now that we have configured Nginx to show stats, it’s time to create the custom metric for the same.
For our Zabbix agent to send Nginx monitoring data to Zabbix server, it needs to have userparameter defined in its configuration file. So, create a new configuration file for Zabbix agent:
[shell]
vi /etc/zabbix/zabbix_agentd.conf.d/userparameter_nginx.conf
UserParameter=nginx.active.conn,curl localhost/nginx_status 2>/dev/null | head -1 | cut -d ":" -f 2 | | cut -d " " -f 2
UserParameter=nginx.server_accept,curl localhost/nginx_status 2>/dev/null | head -3 | tail -1 | cut -d " " -f 2
UserParameter=nginx.server_handled,curl localhost/nginx_status 2>/dev/null | head -3 | tail -1 | cut -d " " -f 3
UserParameter=nginx.server_request,curl localhost/nginx_status 2>/dev/null | head -3 | tail -1 | cut -d " " -f 4
UserParameter=nginx.reading,curl localhost/nginx_status 2>/dev/null | tail -1 | cut -d ":" -f 2 | cut -d " " -f 2
UserParameter=nginx.writing,curl localhost/nginx_status 2>/dev/null | tail -1 | cut -d ":" -f 3 | cut -d " " -f 2
UserParameter=nginx.waiting,curl localhost/nginx_status 2>/dev/null | tail -1 | cut -d ":" -f 4 | cut -d " " -f 2
[/shell]
Now that we are done configuring Zabbix agent, let’s restart the service to apply changes. With this, our agent is ready to send custom metric to the Zabbix server.
Now, it’s time to configure the host on Zabbix Server using User Interface. Open Zabbix Server UI and navigate to Configuration-> hosts and click on create host:
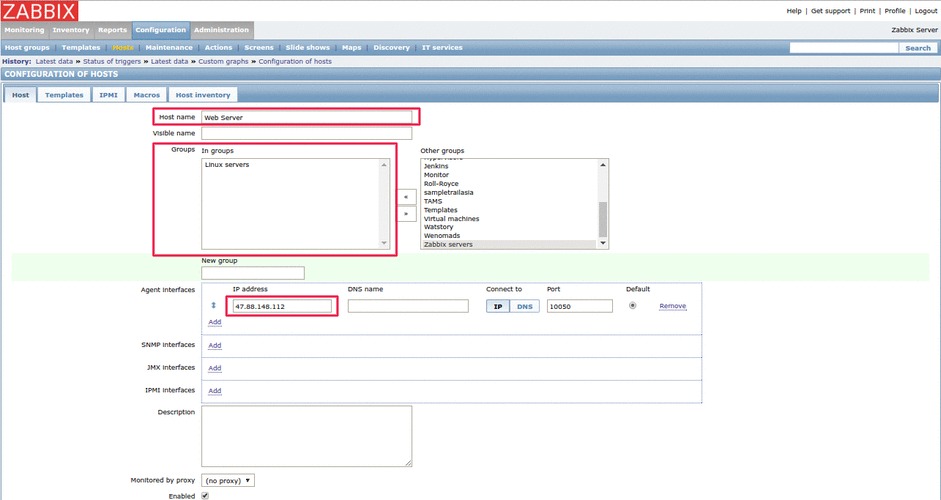
Provide hostname, host group and IP address of the web server and click on add host to create a new host on Zabbix Server:
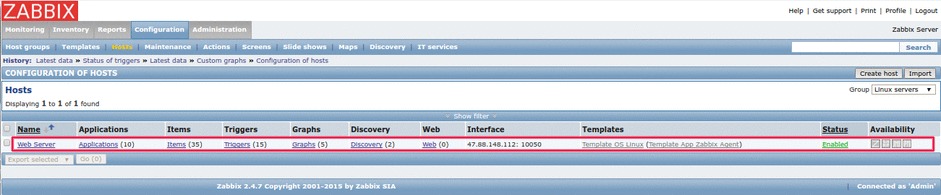
Now, it’s time create custom items to get Nginx monitoring data. To create a new item, navigate to host item and click on create item:
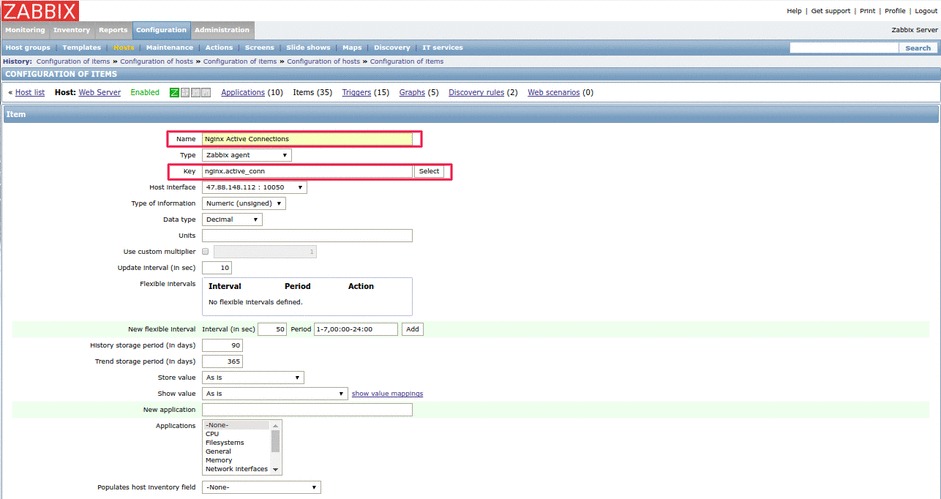
Provide name and key to create a new item. The key should be the same as defined in the userparameter in Zabbix agent(for example:/ nginx.active_conn).
Likewise, create items for all the userparameter configured at Zabbix agent.
Now that everything is configured, navigate to Monitoring->Latest Data and select the host (that you have configured) in the filter section:
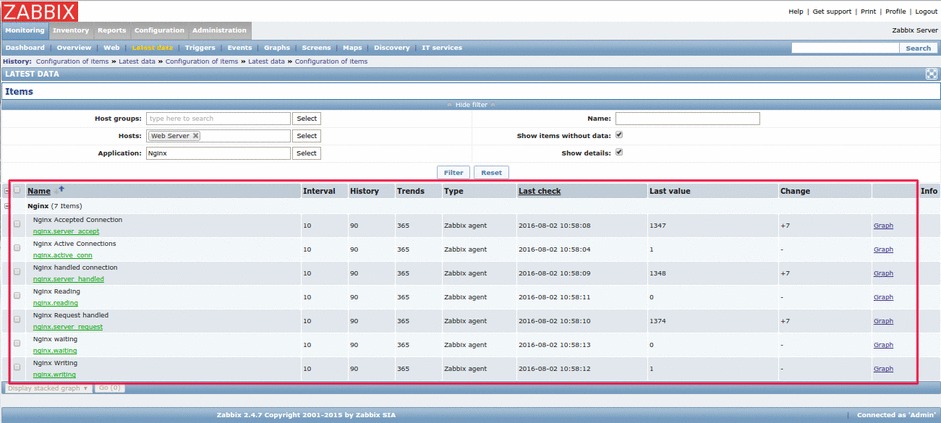
The above image shows the latest value gathered by all the items.
There you have it, another amazing feature of Zabbix.