Monitoring MongoDB using New Relic
Scope
This blog illustrates advantages of New Relic over different monitoring strategies and step by step method to configure new relic plugin for mongoDB.
What is New Relic?
New Relic is a SaaS model (Software as a service) that provides capabilities to monitor applications in real-time.
Why I chose New Relic to monitor MongoDB over different monitoring strategies?
1. Utilities such as mongostat, mongotop are used for immediate results. They do not give us a trend over time in a graphical manner on a visual dashboard.
2. These utilities require us to login to the DB instances, whereas New Relic plugins exempt us from this.
3. Advanced features such as alerts are not supported by these utilities.
4. As compared to self-hosted monitoring tools like ‘Nagios’, New Relic has several advantages:-
- Since New Relic is based on Saas model it frees us from overheads of infrastructure management and high availability concepts.
- New Relic provides multiple monitoring parameters such as Operations per second, Transactions, queries by default whereas we need to configure each parameter in Nagios.
Demo Setup
Installation and Configuration Steps:-
Note: These steps are performed on Ubuntu machine:-
- Download the latest release of new relic plugin for MongoDB from GitHub(Link).
- Move config/template_newrelic_plugin.yml to config/newrelic_plugin.yml
- Modify different configuration parameters in newrelic_plugin.yml (license_key, agent_name, username and password)
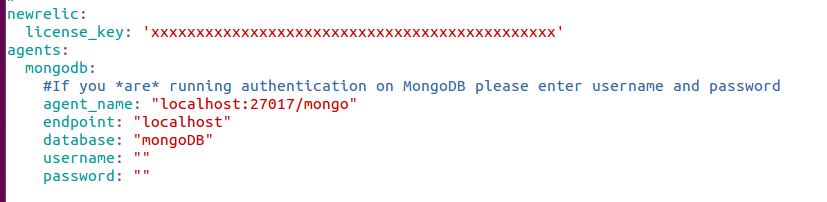
- New Relic provides a license when you sign up. You need to provide the same in the configuration file.
- To install the gems listed in Gemfile run bundle install.
- Foreman is used to manage Procfile-based applications, foreman start is used to run your application directly from the command line, Run foreman start.
- Login to your New Relic account.
- Go to Plugins Tab.
- You can see your agent name on the console.
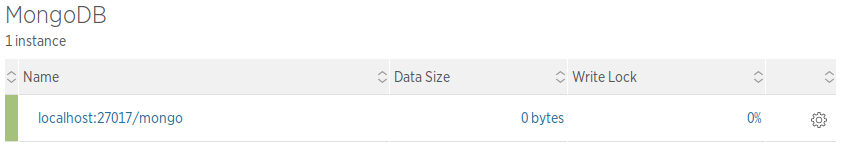
- Click on agent name to see monitoring graphs overview for your agent.
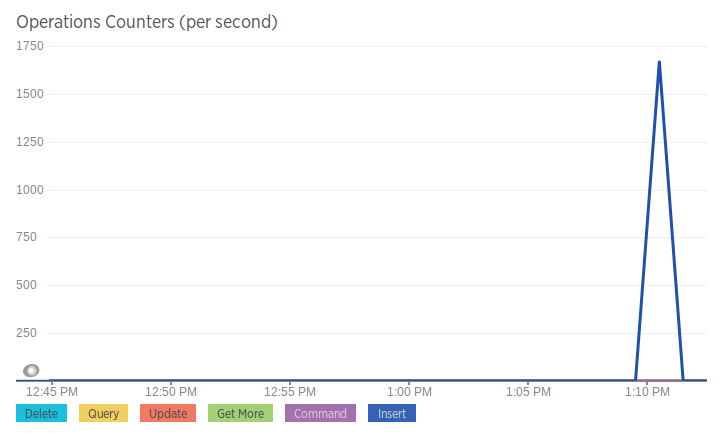
For the demo, I have run a query that inserts 10000 collections in the database.
[js]
var insertT = function() {
var start = (new Date()).getTime();
for (var i=0; i< 10000; i++) {
db.task1.insert({"user" : "Coldsky", "finished" : i, "unfinished" : 1000000 – i})
}
var end = (new Date()).getTime();
var diff = end -start;
print("Insert 1M documents took " + diff + "ms" )
}
insertT()
[/js]
The plugin newrelic-mongodb-agent installed will monitor following metrics by default:-
- Operations/Second: It reflects average operations (query, update, delete, etc) per second.
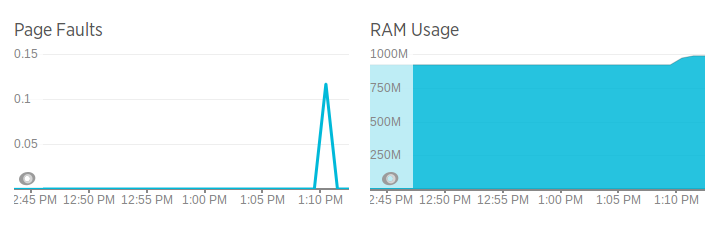
- RAM Usage: The amount of available RAM should be working set size, the size of indexes, rest of the OS, other software running on the same machine.
- Disk Size: % of disk space used by the collections.
- Lock%: It represents the total amount of time spent in write lock. This value increase when more write operations (updates, inserts, deletions) are done on the database.
- Page Faults: Page faults can occur as MongoDB reads from or writes data to parts of its data files that are not currently located in physical memory.
Note: It takes up to 5 minutes for New Relic to show graphs.
In this blog, I have talked about one of the plugins offered by New Relic for monitoring mongoDB. Similarly, you can choose a different plugin based on the default metrics it offers.