
Prediction Analysis using Knime
Prediction Analysis is the practice of extracting information from existing data sets in order to determine patterns and predict future outcomes and trends. There are various analytic and machine learning tool available in the market for predictive analysis.
This post includes introduction of Knime followed by a sample use case of clustering using Knime and Knime Big Data Extension. If you want to know more about Predictive Analysis, please refer Introduction of Predictive Analysis.
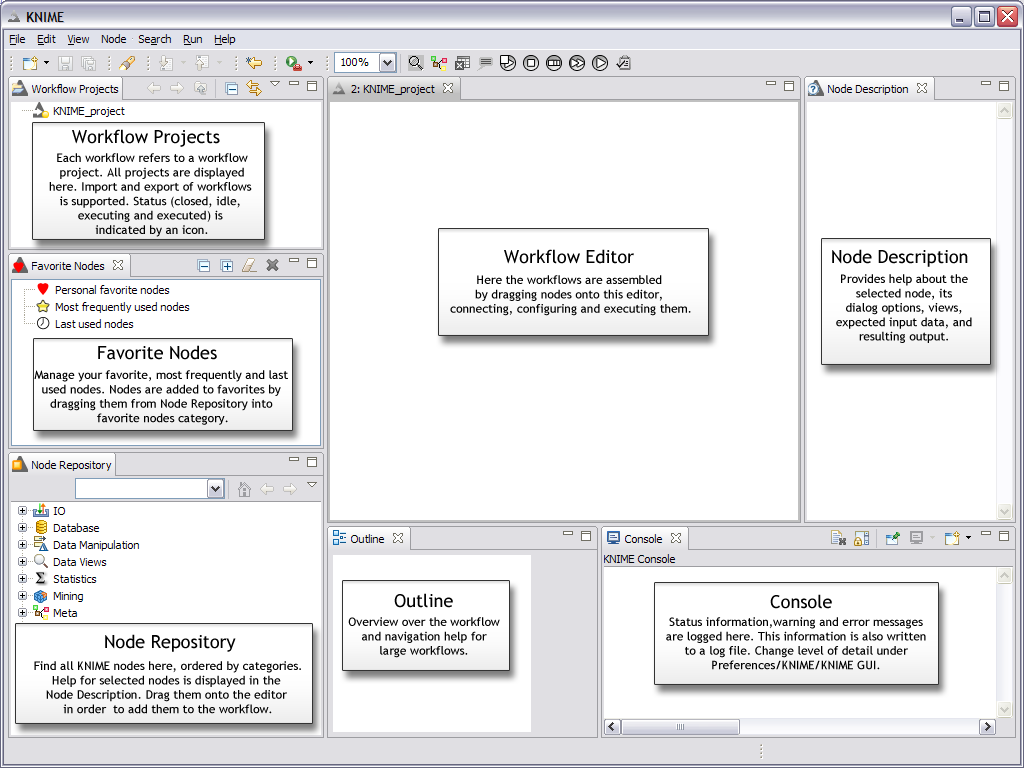
Knime – Knime is a data Analytics Platform which incorporates data processing and cleansing, modeling, analysis and data mining as well as various interactive views, such as scatter plots, parallel coordinates and others. Knime provides an abstraction called Nodes, which is a smaller unit of building work-flow in Knime.
Knime is based on the Eclipse platform and provides a visual programming language based on data-flows to create an easy-to-understand analysis process quickly.
Clustering using Knime – I will explain step-by-step process of building a small, simple workflow: we read in data from an ASCII file, assign color to it, cluster the data and display the data in a table and a scatter plot.
If you want to know more about Knime setup please refer and follow the instruction. I assume you have just started Knime with an empty workflow.
Steps –
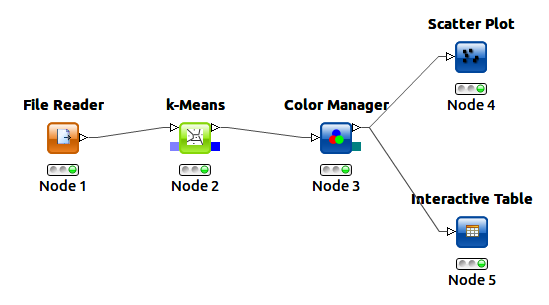
- In the Node Repository expand the “IO” and the contained “Read” category and drag & drop the File Reader icon into the Workflow Editor window.
- Drag the K-Means node in the flow from the Mining -> Clustering in Node Repository.
- Search for “color” in Node Repository. Pull the Color Manager node into the workflow.
- Now, drag the Interactive Table and the Scatter Plot from the Data Views category to the Workflow Editor.
- Next step is connecting the nodes to flow data from one node to another. Click an output port of node and drag the connection to an appropriate input port of other node. Complete the flow as by connecting all the nodes as per below image.
- Next step is configuring the nodes. Start with the File Reader, right-click it and select “Configure” from the menu. Select IrisDataSet path in data URL.
- Lets leave all other nodes with default settings.
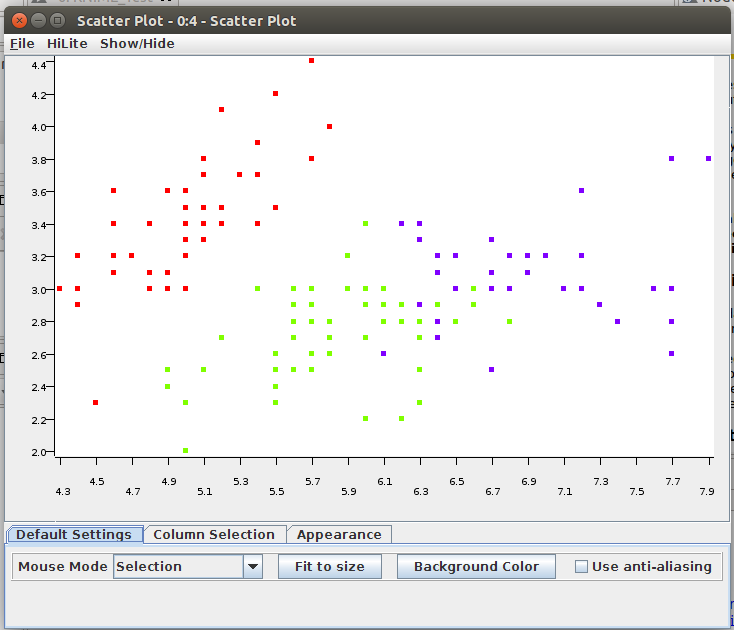
- Now execute the Scatter Plot node by selecting Execute from context menu. Workbench will execute all predecessor nodes for you.
- To examine the data and the results, open the nodes’ views. It will looks like below image.
Knime Big Data Extension – Knime Big Data Extension offers a set of nodes for accessing Hadoop/HDFS via Hive from inside Knime. Extension database connection can be used with almost any of Knime’s standard database nodes.
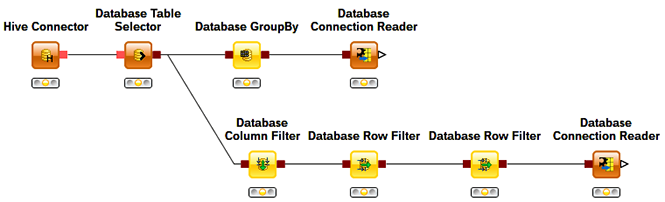
Hive does not allow modification of data. Only inserting and appending data are supported. Since data import does not follow standard SQL/JDBC procedures, the Big Data extension provides a special Hive Loader node. The node makes use of the File Handling extensions and first copies the data onto the Hive server. Then a Hive command is executed to import the data into Hive. The node’s output is a database connection operating on the imported table.
