Introduction
Applications can fail in a lot of different ways – API failures, UI errors, server issues, or incorrect input from a user. When something goes wrong in a production environment, it can be difficult for people to replicate the error in their local environment.
To address the above challenge in development, teams can use tools like Rollbar to provide instant feedback on error activity in their applications.
In Today’s Post
We will take a close look at how to set up and install Rollbar with your Next.js app and what we can do with Rollbar in order to capture errors from your User Interface (UI).
Why Do We Need Error Monitoring?
While you are building your application, you will easily see errors as they are thrown in your Browser Console (or Terminal). After the code is put into production, you lose that visibility of error occurrences.
In the absence of an error monitoring system in production:
- Developers will not be aware of any broken code running in production environments
- Any bugs that have made it into production will likely go undetected by the development team
- Debugging issues will become a more difficult task
- The end-user experience will be negatively affected
This is where Rollbar can help your team out!
Rollbar will automatically capture:
- All client-side errors
- Unhandled exceptions
- Errors in a React component
- Custom logs
- Performance-related events
The errors that are collected by Rollbar are visible on the Dashboard, where all the developers can work together to troubleshoot and resolve the problem(s).
What is Rollbar
Rollbar is a platform for monitoring and debugging errors in production environments, used by developers to detect, track, and fix them. Features include:
– Real-time error tracking
– Detailed stack traces
– Grouping of errors
– User context information
– Deployment tracking
– Alerting and notifications
When an error occurs in your application, Rollbar records the following information:
– Error message
– Stack trace
– Browser/environment details
– Route info
This information provides developers with a snapshot of what caused the problem and can help speed up the identification of root causes.
The Rollbar Workflow
The basic workflow looks like this (followed by developers):
– User interacts with your app
– An error occurs at either the front or back end
– Rollbar automatically captures the error (or you can log it manually)
– The error is sent to Rollbar servers
– Developers can view the error on their Rollbar dashboard
This allows you to better monitor for errors that occur in real-world scenarios.
Establishing Rollbar In A Project With Next.js As The App Router
Let’s go step by step.
Step 1: Install The Rollbar Packages
You will need to install two dependencies:
npm install rollbar @rollbar/react
Both packages serve different but complementary purposes to work with this implementation:
- rollbar → is the core Rollbar SDK;
- @rollbar/react → allows you to use React integration via Error Boundaries and/or hooks.
Step 2: Configure Your Environment Variables
You will need to create two Rollbar tokens to configure your Rollbar SDK in the application.
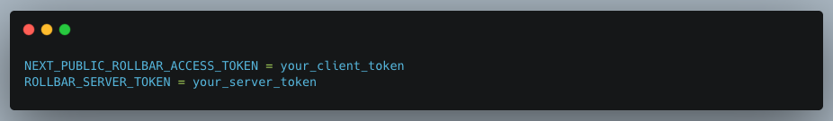
Regarding the above statement:
Variable Purposes
NEXT_PUBLIC_ROLLBAR_ACCESS_TOKEN – Get used in the browser;
ROLLBAR_SERVER_TOKEN – Get used on the server;
Storing token values as environment variables helps to secure the value while providing different flexible configurations through different environments throughout a project or multiple projects.
Step 3: Create A Rollbar Configuration
Create a file: path/rollbar.js
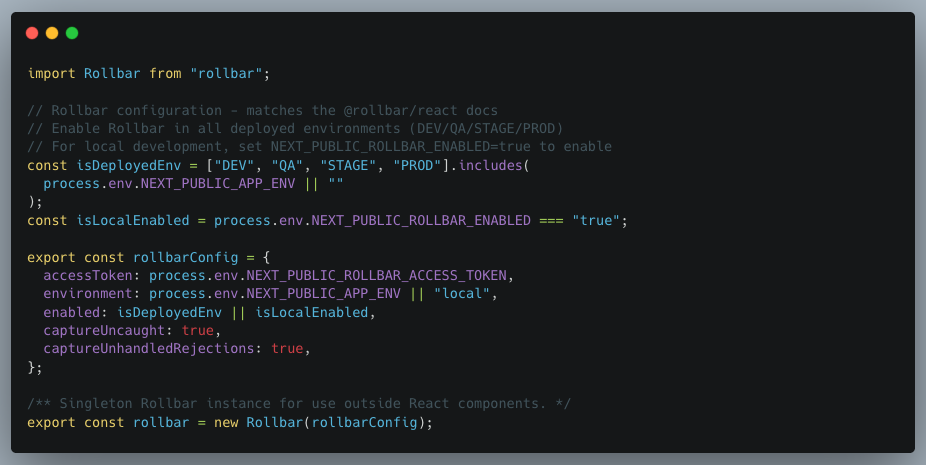
Rollbar Configuration
This initializes the Rollbar client used across the application.
Step 4: Add Rollbar Provider in the Root Layout
In a Next.js App Router project, we typically wrap our application with providers in the layout.
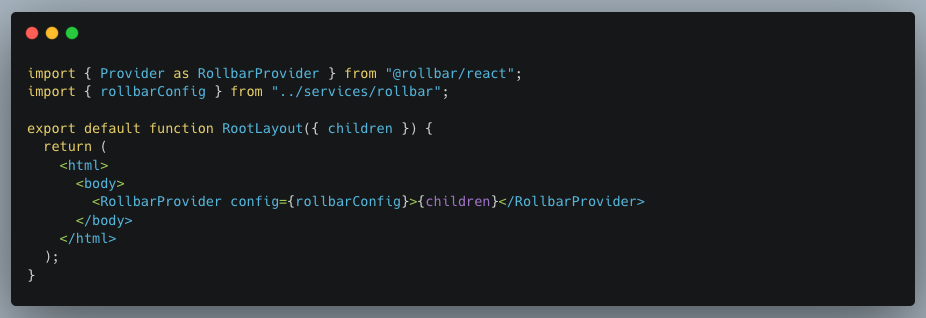
Rollbar Provider
This makes Rollbar available throughout the application.
Step 5: Using a Global Error Boundary
React applications can fail due to runtime errors in components. To catch these errors gracefully, we can use an Error Boundary.
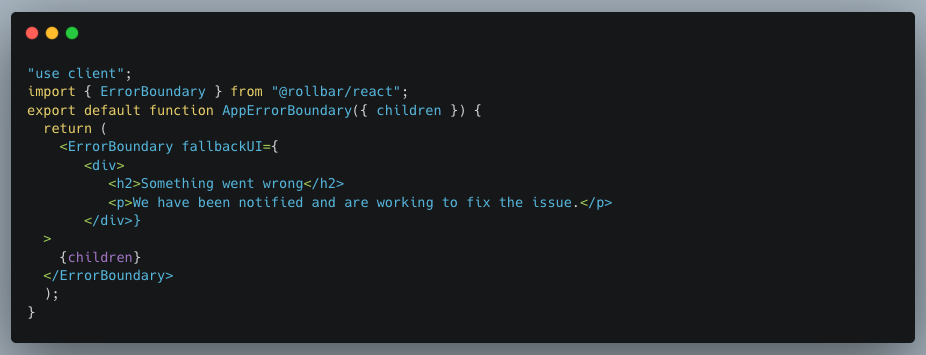
App Error Boundary
Usage:
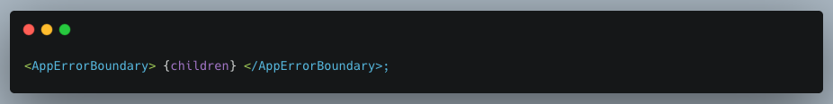
If a component crashes, Rollbar captures the error automatically.
Step 6: Manual Error Logging
Sometimes we want to log errors or events manually.
Example:
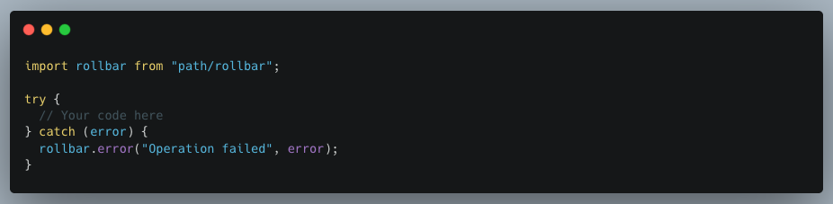
Manual Error Logging
Other logging levels:
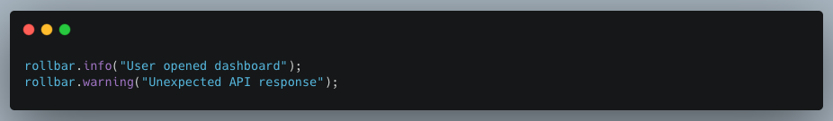
Logging Levels
This helps developers log meaningful events in production.
Step 7: Logging API Errors using Redux Toolkit and Axios
Many applications that make calls to an API typically use Redux Toolkit with Axios. You can log API errors when they happen in thunks or service functions. Below is a sample code that will log any exception thrown when calling an API to get user data from the API.
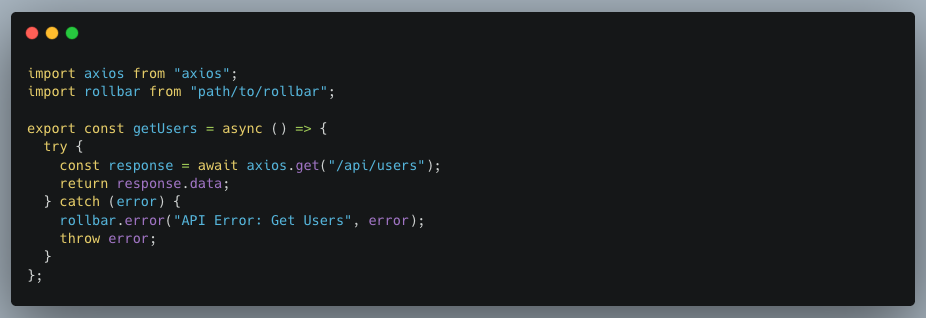
Logging Axios Errors
This allows you to see any errors that happen on the backend and still show up in Rollbar.
Tracking Errors in the Rollbar Dashboard
When Rollbar captures an error from your Next.js application, it organizes the errors into items. Each item is a distinct error type and contains all information needed for a developer to resolve the error. Below, we will describe the major areas a developer would find useful when troubleshooting errors.
1. Items (Error List)
Rollbar → Items tab
Developers use the Items page as their primary tool to track application errors.
Rollbar divides errors into distinct items that represent different types of errors. Rollbar combines identical errors into one group to prevent excessive error display.
The Items list shows common information, which includes:
- Error message
- Number of occurrences
- Number of affected users
- Last occurrence time
- Error status
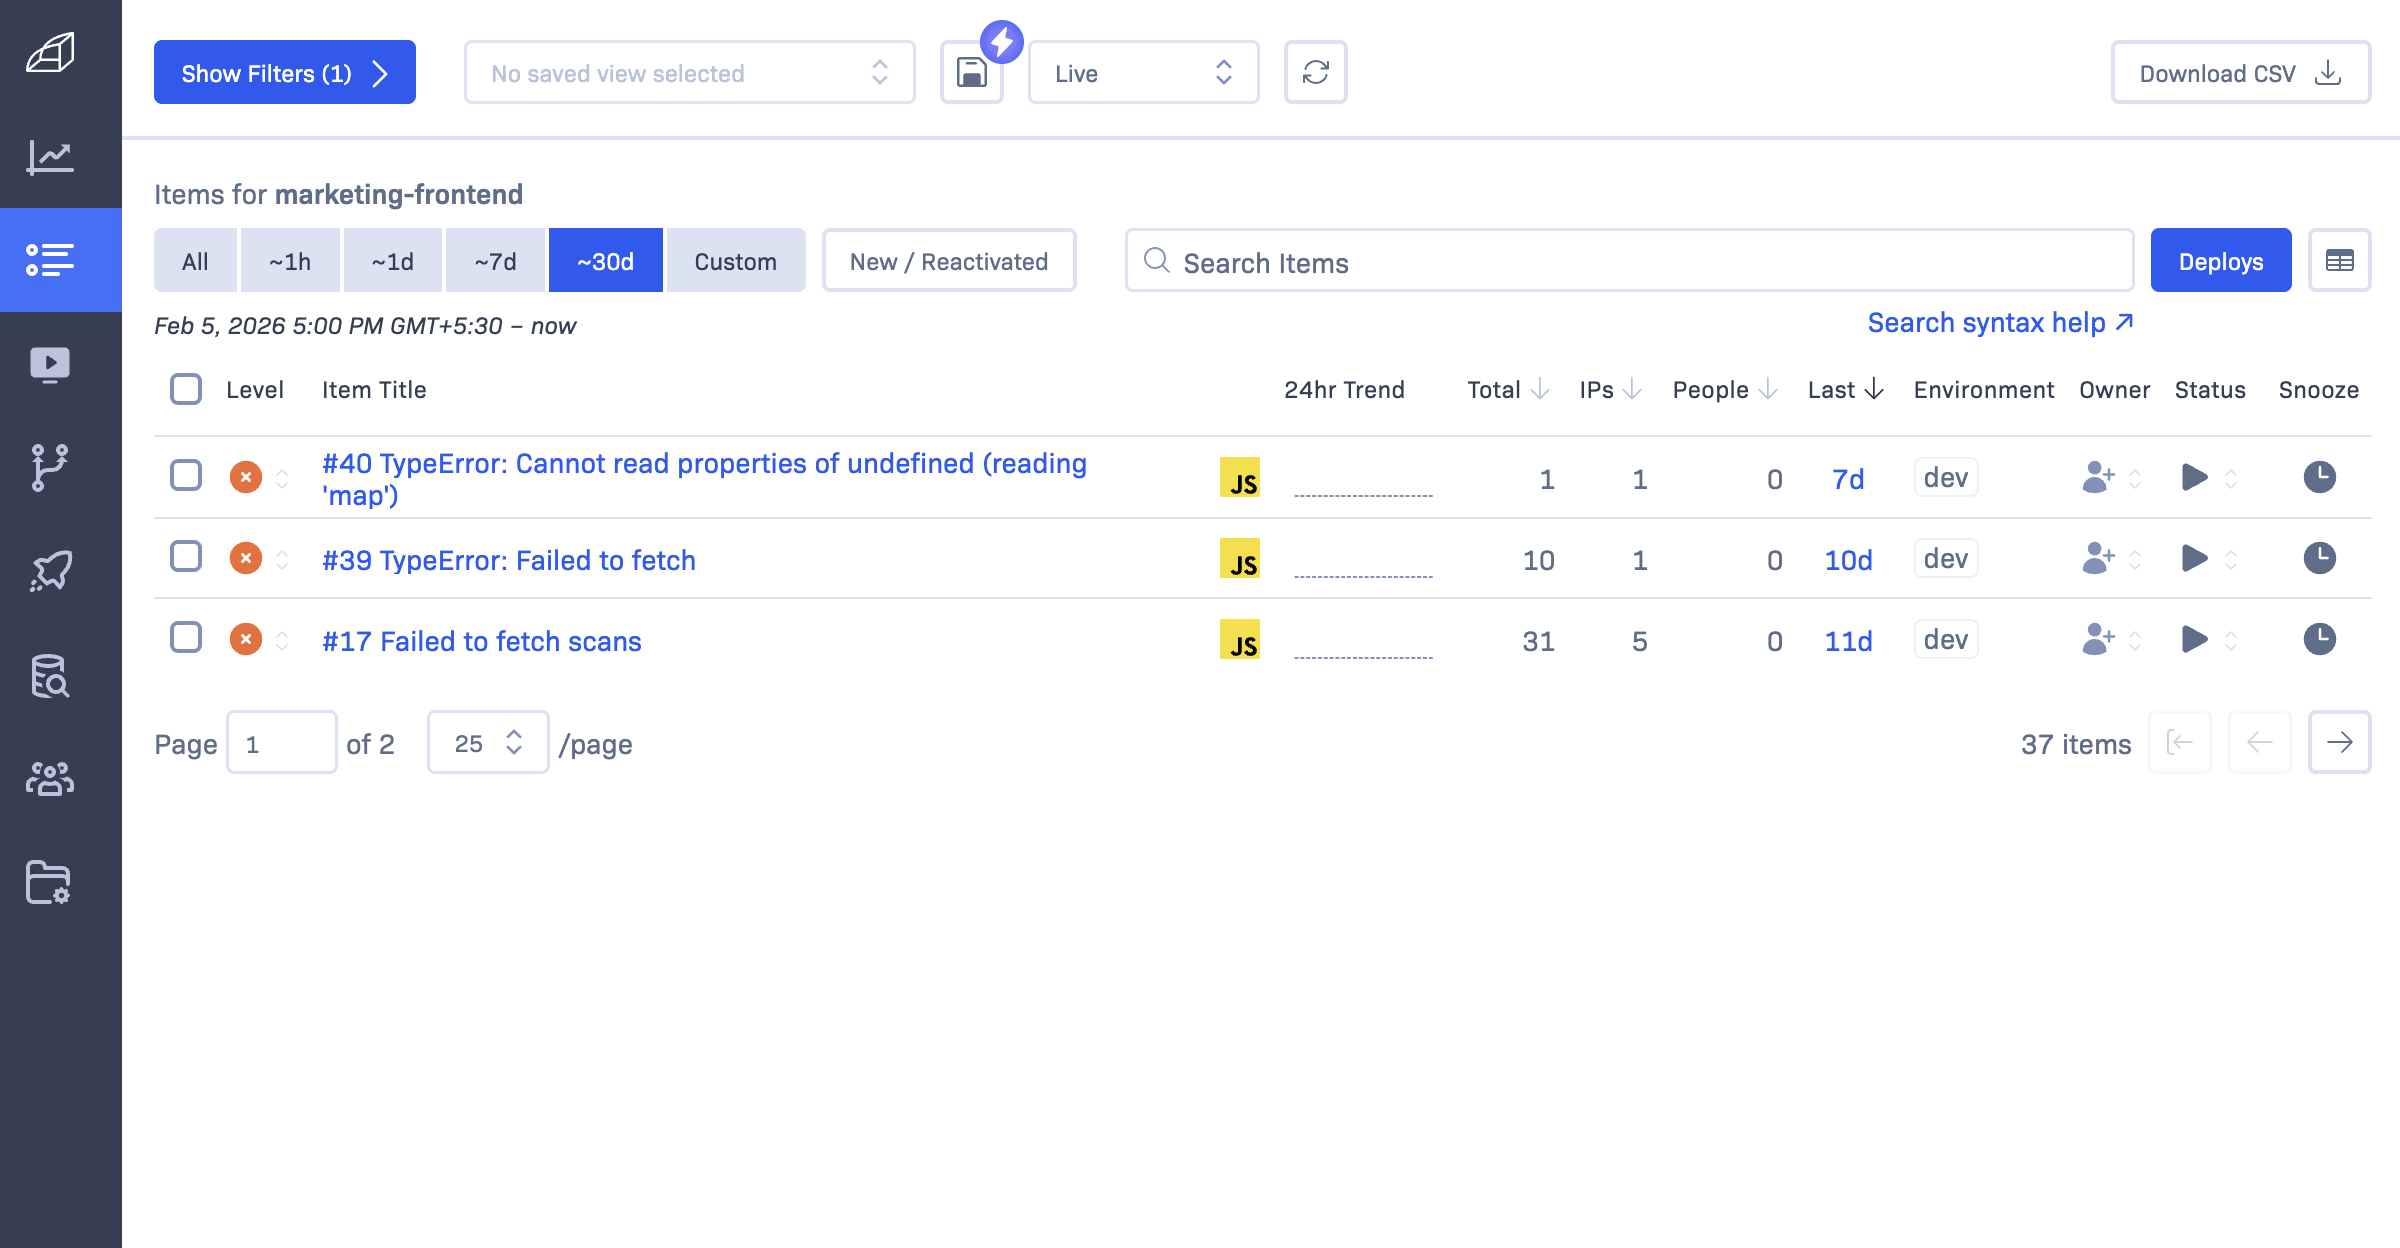
Errors list
2. Stack Trace (Where the Error Happened)
Rollbar → Error Item → Stack Trace section
The Rollbar system shows an error detail view, which opens when developers select an error item. The Stack Trace section represents the most critical area in this section.
A stack trace shows exactly where the error occurred in the code.
The stack trace provides information about the following elements
- File name
- Function name
- Line number
- Component hierarchy
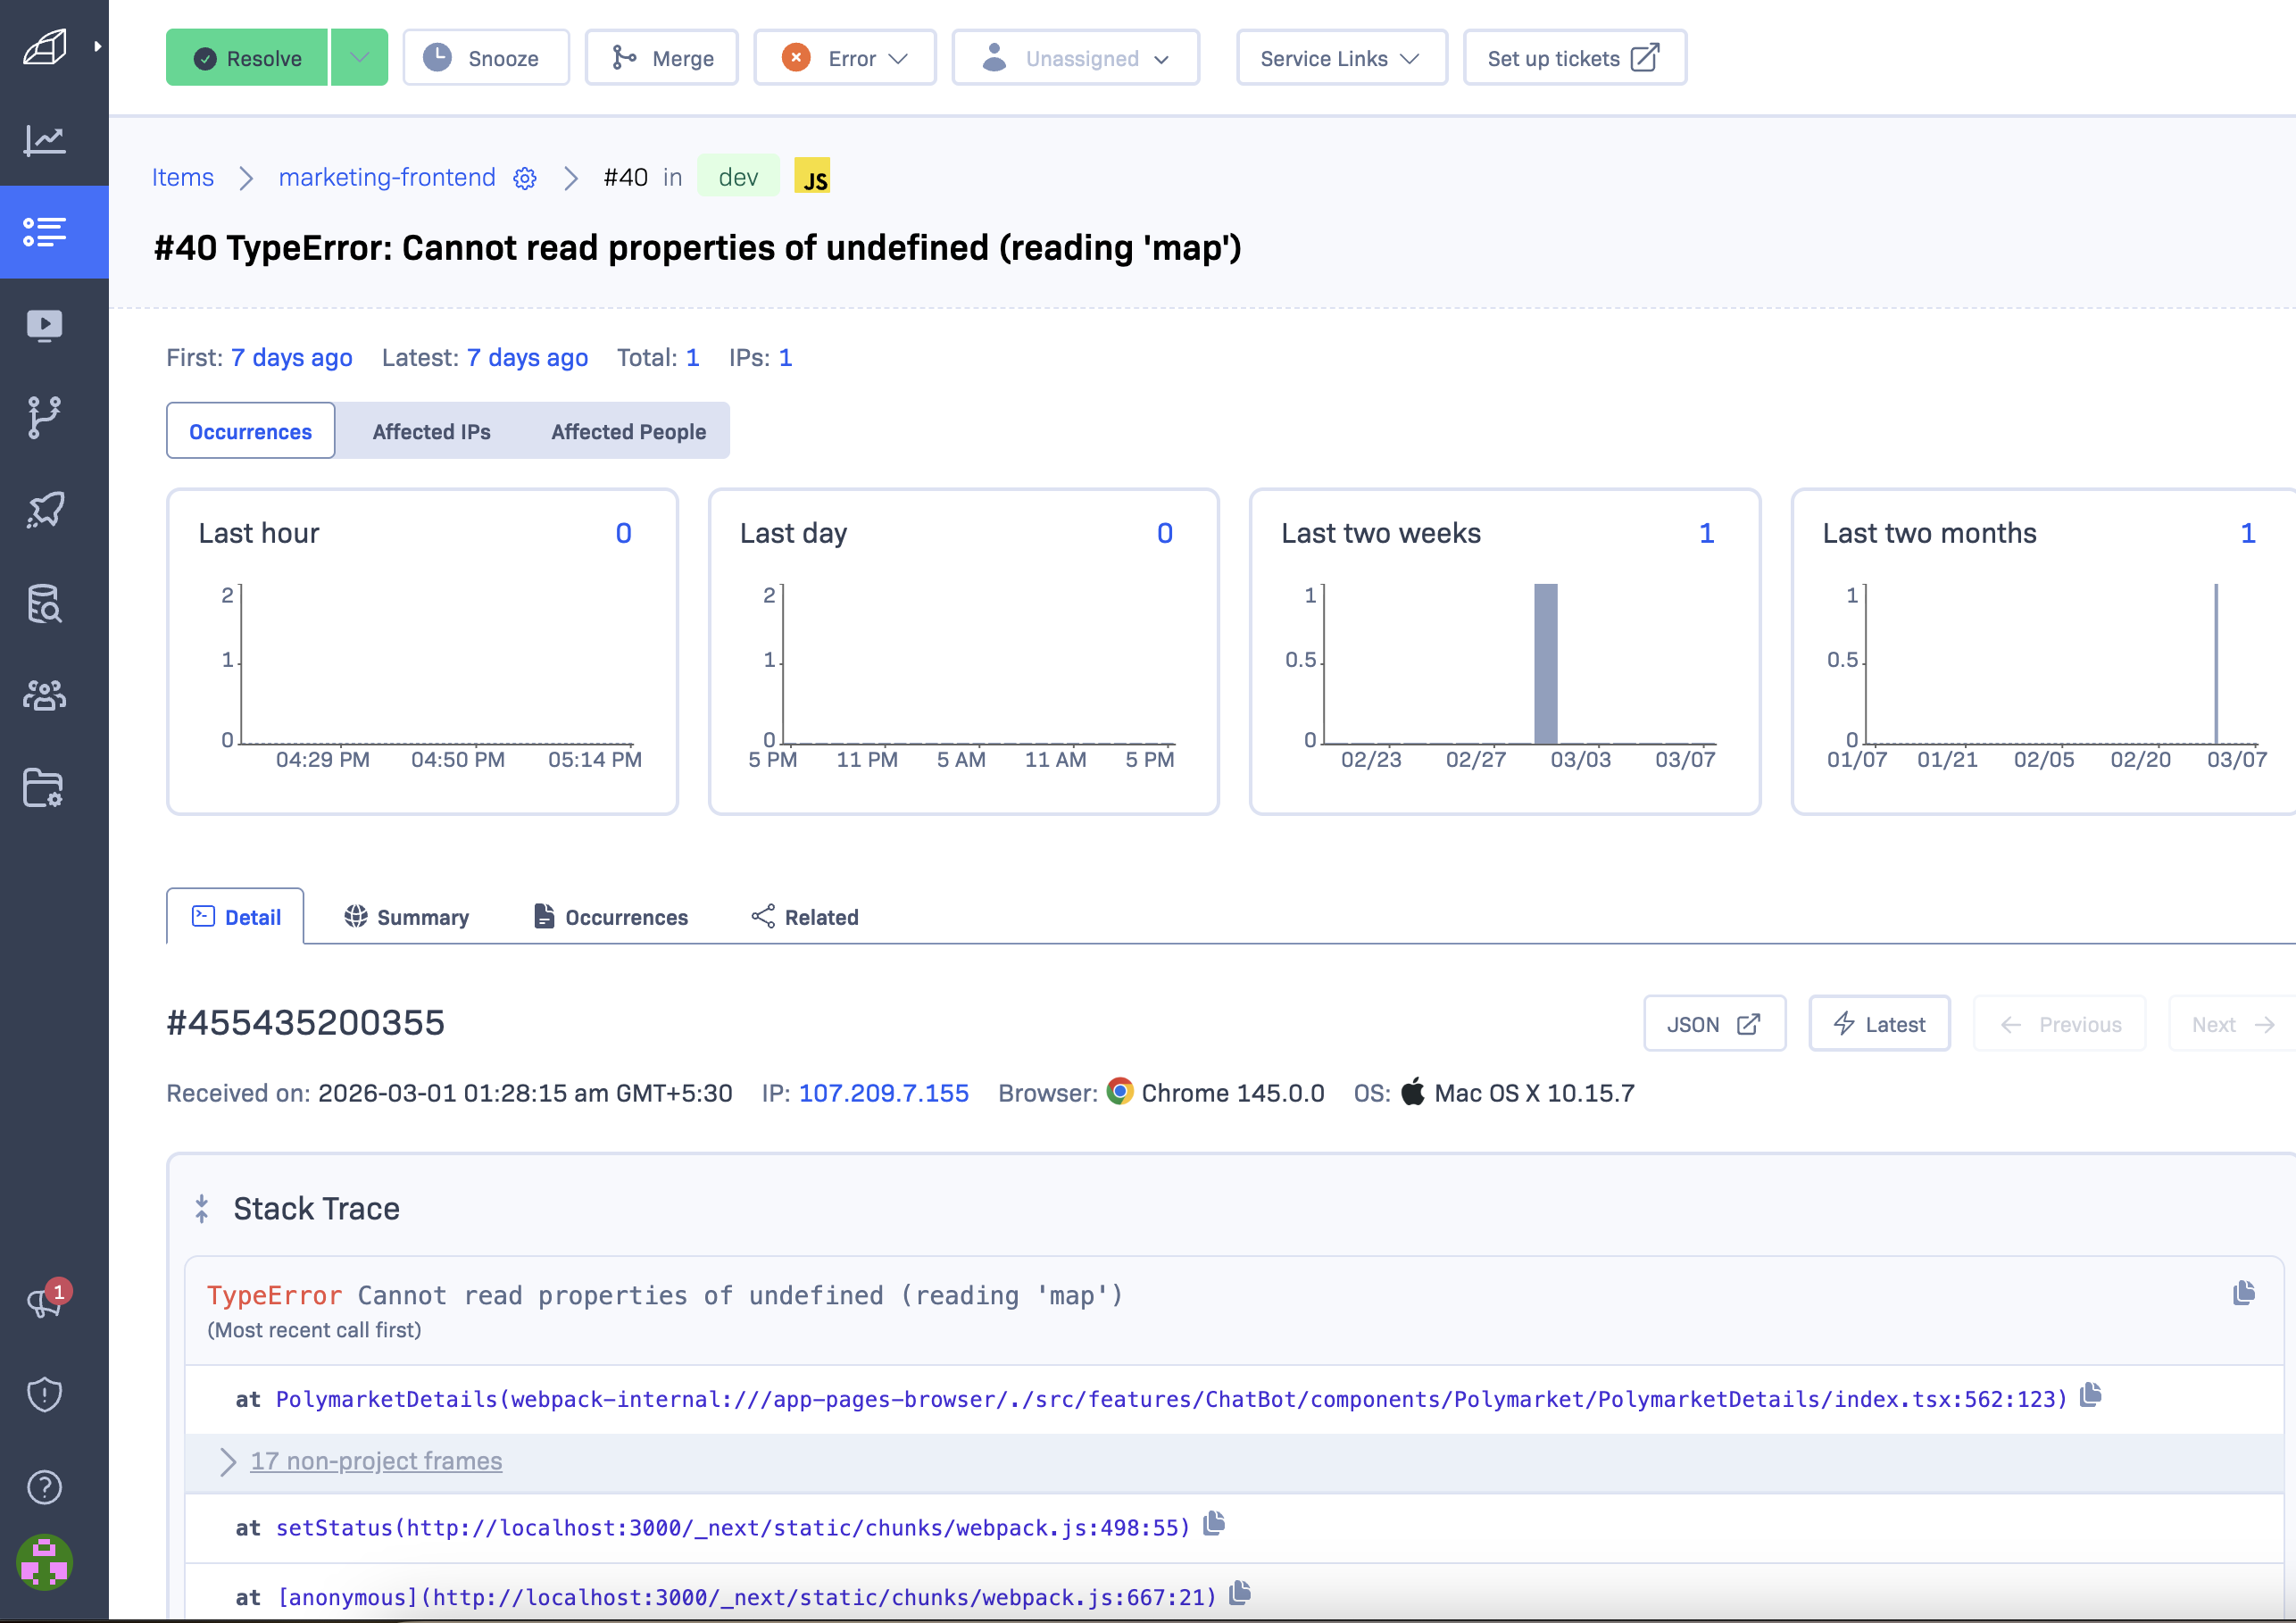
Stack Trace
This approach enables developers to find the defective code without delay.
3. Telemetry (Events Before the Error)
Rollbar → Error Item → Telemetry tab
The Telemetry section provides a timeline of events that happened just before the error occurred.
This approach proves to be highly effective for reproducing software defects.
Telemetry may include events such as:
- User navigation
- Button clicks
- API requests
- Console logs
- Custom logs
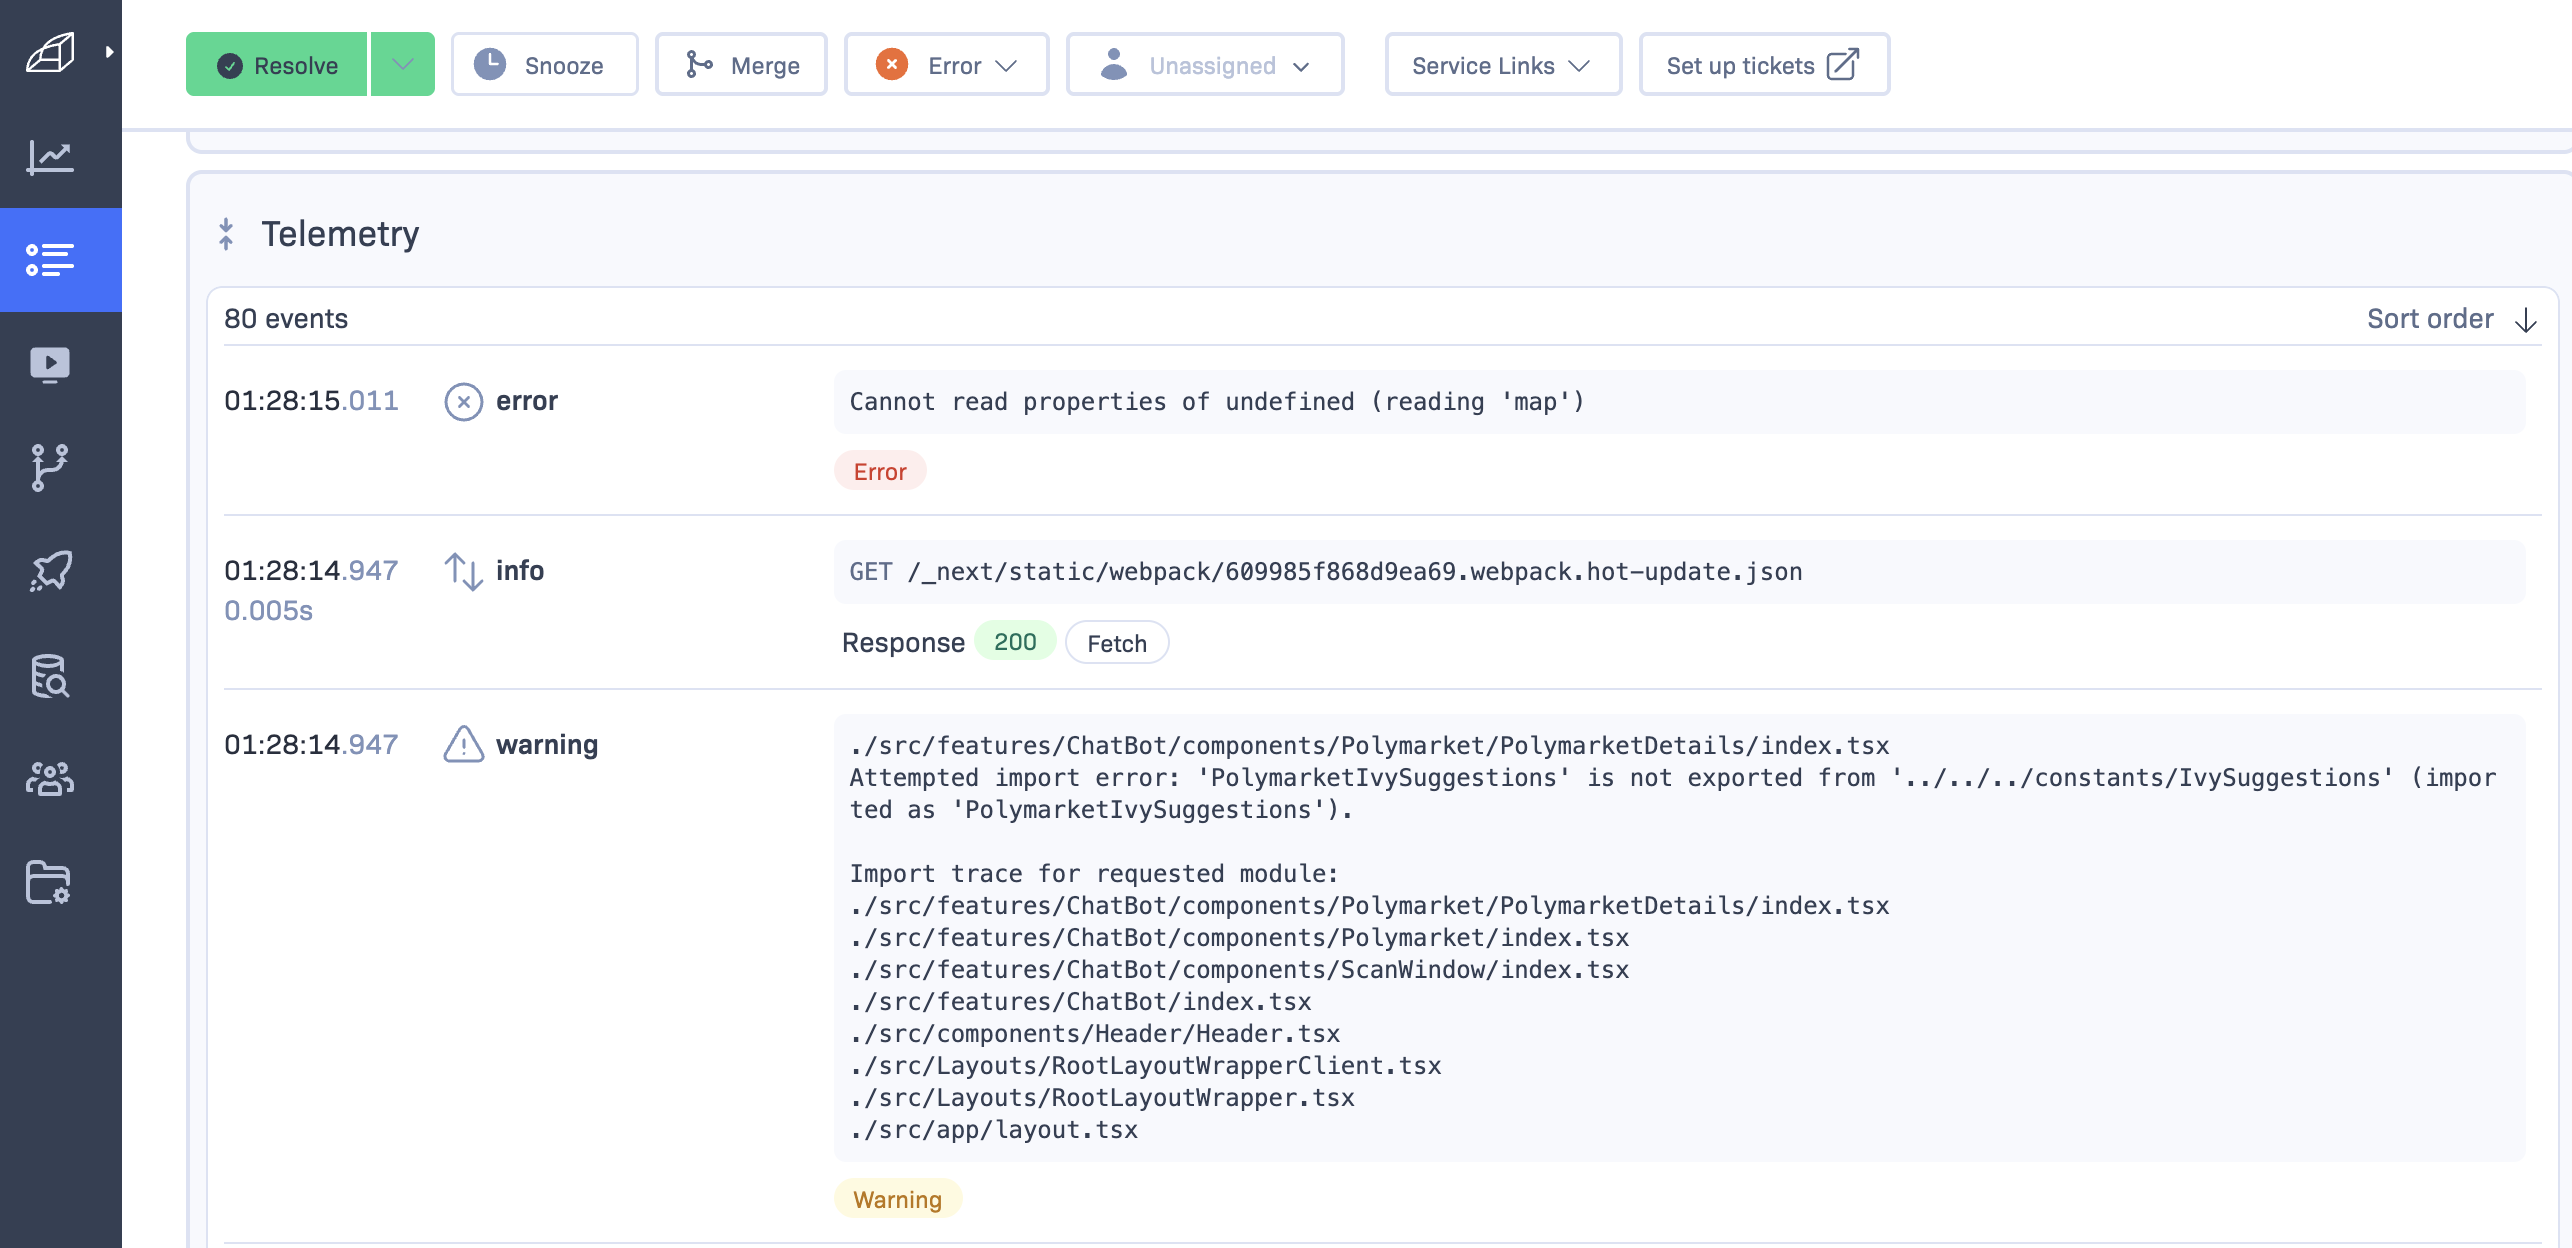
Telemetry
Example Debugging Workflow Using Rollbar
Here’s how a developer typically investigates an issue using Rollbar:
- The Items page should be opened to display all newly created errors
- The error that has the most total occurrences should be selected
- The Stack Trace should be examined to find the defective code
- The Telemetry should be examined to find out what occurred before the system crashed
- The developer needs to reproduce the issue on his own system
- The developer needs to fix the bug and deploy the update
Final Thoughts
Modern application development requires error monitoring as a necessary component. Rollbar provides teams with tools that enable them to identify and fix problems, which leads to better system performance and enhanced user satisfaction.
The implementation of Rollbar allows Next.js developers to track production errors, monitor application health, and debug issues more efficiently while achieving better application stability.
Your application will maintain its reliability through proper monitoring methods that allow it to grow.