Introduction
We recently needed visibility into what our Java services were actually doing in production — response times, slow queries, errors, that sort of thing. We landed on Elastic APM. Here’s exactly how we set it up, including some decisions we made around multi-environment support that saved us a lot of headache later.
The setup covers:
- Installing and configuring the APM Server
- Attaching the Elastic APM Java Agent to a Spring Boot application
- Using a single Dockerfile and an init script across environments
- Parameterizing the configuration so UAT and Production send data to their respective APM servers
This approach works well when you want consistency across environments without duplicating Docker images or startup logic.
Step 1: Find the APM setup in Kibana
Log into Kibana, go to Observability → APM, and follow the on-screen instructions. It’ll ask for your application type and OS. This gets you the right install path without guessing.
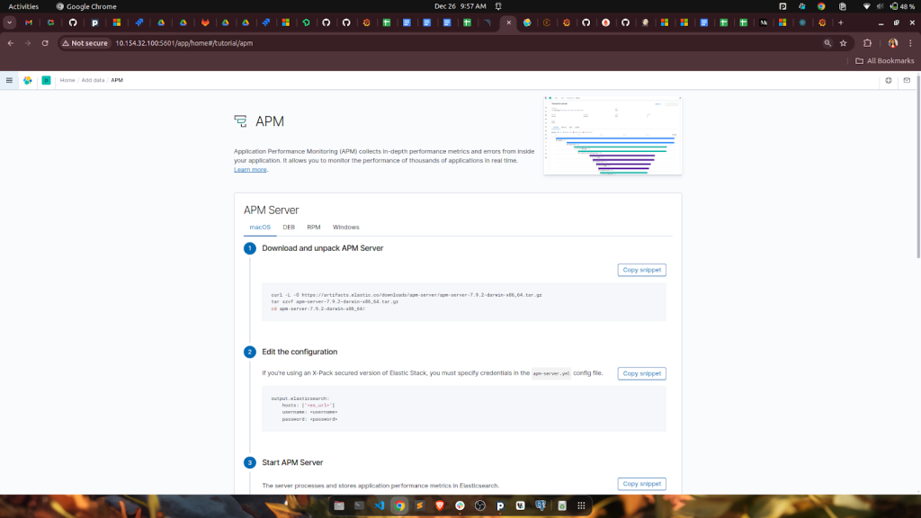
server
Step 2: Install APM Server on the Elasticsearch VM
On the VM running Elasticsearch, install and start the APM Server:
sudo apt install apm-server
sudo systemctl enable apm-server
sudo systemctl start apm-server
Once it’s running, the server listens on port 8200. At this stage we’re just confirming the backend is up and ready to receive data before touching the application.
Step 3: Get the APM Java agent and store it in Blob Storage
Download the agent JAR from Maven:
wget https://search.maven.org/remotecontent?filepath=co/elastic/apm/elastic-apm-agent/1.52.1/elastic-apm-agent-1.52.1.jar
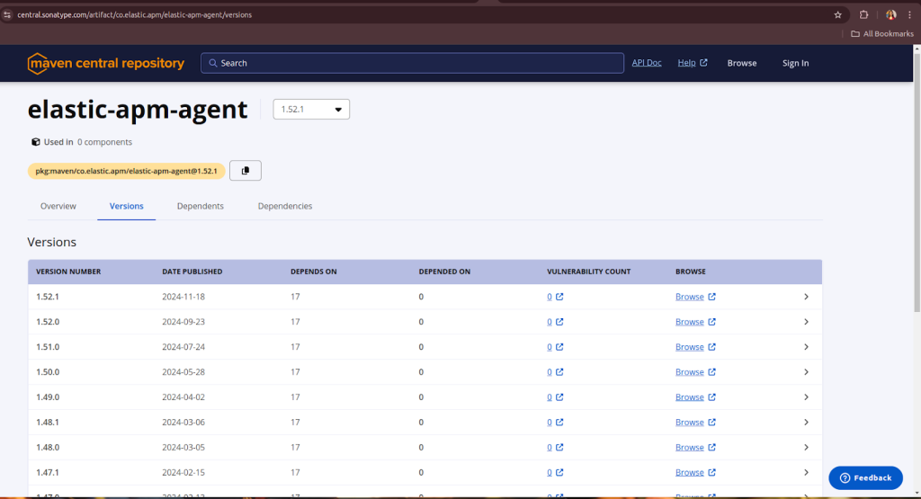
apm jar
Rather than baking this into the Docker image, we pushed it to Azure Blob Storage. The reason: when Elastic releases a new agent version, we can swap it out without touching the image or triggering a full rebuild. Same logic applies if you ever need to roll back — just point to the old JAR.
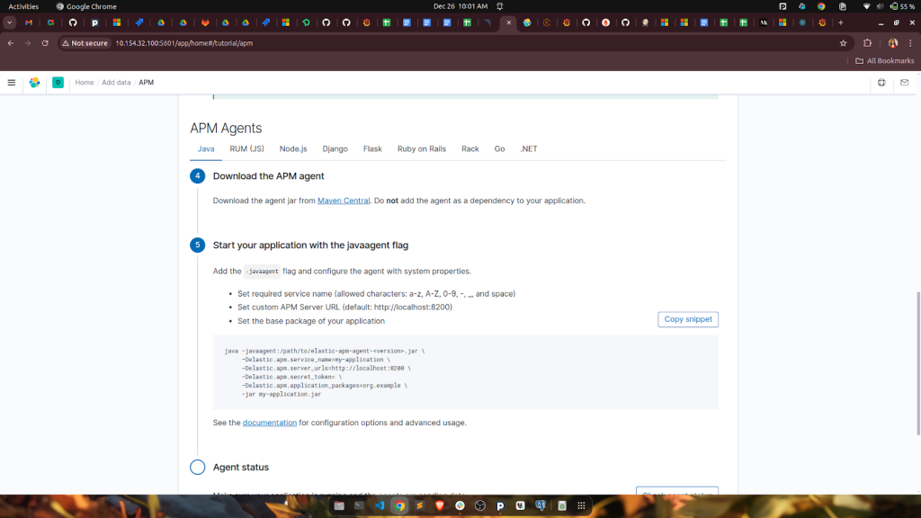
Step 4: Pull the agent at startup and attach it to the app
Inside init.sh (the container’s startup script), we download the agent from Blob Storage using azcopy, then pass it as a -javaagent flag when starting the application:
azcopy cp "https://<storage-account>.blob.core.windows.net/apmkibana/elastic-apm-agent-1.52.1.jar?<SASTOKEN>" "/usr/local/apm"
java -javaagent:/usr/local/apm/elastic-apm-agent-1.52.1.jar \
    -Delastic.apm.service_name="${apm_service_name}" \
    -Delastic.apm.server_urls="${hostname}" \
    -Delastic.apm.secret_token= \
    -Delastic.apm.application_packages=org.example \
    -jar /app/application.jar \
    --spring.config.location=...
The service name and APM server URL come in as environment variables — no hardcoded values anywhere. This means the same startup script handles UAT and production without any changes.
agent
Step 5: The Dockerfile stays generic
We deliberately kept the Dockerfile environment-agnostic. All the environment-specific behaviour lives in runtime config, not the image:
FROM xyz.azurecr.io/java_baseimage:latest
ARG artifact_version
LABEL artifact_version=$artifact_version
WORKDIR /app
COPY init.sh /init.sh
RUN chmod 500 /init.sh
RUN mkdir -p /tmp/images /opt/conf /opt/tmp /usr/local/apm
COPY build/libs/*.jar application.jar
ENTRYPOINT /init.sh
One image, all environments. Keeps things simple and avoids drift between UAT and production builds.
Step 6: The full init.sh
Here’s the startup script in full. A few things worth noting: JVM tuning flags are set here (G1GC, heap bounds, GC logging), the APM agent is downloaded fresh on each container start, and application config files are pulled from Blob Storage too:
#!/bin/bash
set -xe
JAVA=$(which java)
# Download APM agent
azcopy cp "https://xyz.blob.core.windows.net/apmkibana/elastic-apm-agent-1.52.1.jar?<SASTOKEN>" "/usr/local/apm"
# Download config
bucket=${CONFIG_BUCKET}
azcopy cp "${bucket}/${namespace}/${CONFIG}/core/resources/application-${filename}-common.properties${BUCKET_TOKEN}" "/opt/conf/core/application-${filename}-common.properties"
azcopy cp "${bucket}/${namespace}/${CONFIG}/${APP_TYPE}/resources/application-${filename}.properties${BUCKET_TOKEN}" "/opt/conf/${APP_TYPE}/application-${filename}.properties"
chmod -R 777 /app /opt/conf /opt/tmp
$JAVA -XX:MinHeapFreeRatio=40 -XX:MaxHeapFreeRatio=70 \
  -Xms500m -Xmx1000m -XX:MaxGCPauseMillis=200 \
  -XX:+UseG1GC -XX:+UseStringDeduplication -Xlog:gc*:/opt/tmp/myapp-gc.log \
  -verbose:gc \
  -Djava.security.egd=file:/dev/./urandom \
  -javaagent:/usr/local/apm/elastic-apm-agent-1.52.1.jar \
  -Delastic.apm.service_name="${apm_service_name}" \
  -Delastic.apm.server_urls="${hostname}" \
  -Delastic.apm.secret_token= \
  -Delastic.apm.application_packages=org.example \
  -jar /app/application.jar \
  --spring.config.location=optional:/opt/conf/core/application-${filename}-common.properties,optional:/opt/conf/${APP_TYPE}/application-${filename}.properties
Environment-based APM Configuration
To support multiple environments (like UAT and Production), we’ve parameterized the APM server URL and service name inside init.sh. This ensures the correct data is sent to the appropriate APM Server based on the environment variables.
Final Step: Verify APM Data
Go back to Kibana > Observability > APM and check if your application’s telemetry is being displayed. If everything is configured correctly, you should see:
- Service names
- Request traces
- Performance metrics
- Errors (if any)
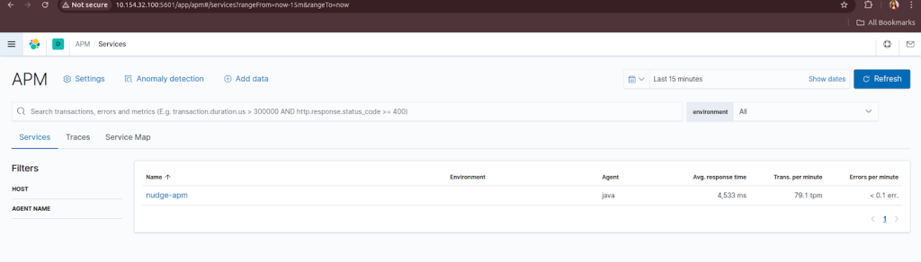
apm dashboard
Note on multi-environment setup:
UAT and production each have their own APM Server. The ${hostname} and ${apm_service_name} variables are set differently per environment in the container's runtime config — the script itself doesn't change. This was the key thing we wanted to avoid: duplicating startup logic or maintaining separate images per environment.
Verifying it works
Once the container is running, go back to Kibana → Observability → APM. If the agent connected successfully you’ll start seeing your service name appear, along with request traces, response time distributions, and any errors. Give it a minute after the first request — it’s not instant.
The things we found most useful straight away: slow database queries showing up in traces, and being able to correlate a spike in error rate to a specific deployment. That alone made the setup worth it.