


From Excel to Python: Every Data Analyst’s Natural Evolution
“The best analyst isn’t the one who creates the most reports. It’s the one who spends the least time creating reports and the most time discovering insights.” That realization completely changed how I approached analytics.
Like many analysts, I started my career living inside Excel.
Every morning looked almost identical:
- Download reports from different platforms.
- Remove duplicates.
- Fix inconsistent date formats.
- Merge multiple files.
- Create pivot tables.
- Check formulas.
- Repeat the same process tomorrow.
It worked. Until the data became too large. Some reports had millions of rows coming from Google Analytics, BigQuery, CRM systems, and campaign platforms. Excel started crashing, formulas became painfully slow, and simple reporting tasks began consuming half the day.
The problem wasn’t the analysis. The problem was preparing the data before analysis even started.
That’s when I discovered Python. Not machine learning. Not artificial intelligence. Just two libraries:
- NumPy
- Pandas
And honestly. They changed the way I work forever.
The Reality Every Analyst Faces
Imagine this.Your manager asks:
“Can you compare yesterday’s campaign performance with the last 90 days, calculate conversion rate, remove duplicate users, group results by city, and send me the dashboard before lunch?”
Sounds familiar? Now imagine the data looks like this:
| Source | Records |
| Google Analytics | 850,000 |
| CRM | 420,000 |
| Sales Database | 310,000 |
| Marketing Platform | 180,000 |
More than 1.7 million records. Doing this manually? Almost impossible. Doing this in Python? A few lines of code.
Let’s Understand about Libraries
A library is a collection of pre-written code, modules, and packages designed to perform specific tasks without forcing you to write everything from scratch. Numpy and Pandas are one of them.
NumPy – The Engine Behind Fast Calculations
NumPy is a library designed for high-performance numerical computing.
Unlike Excel, where formulas are typically applied cell by cell, NumPy performs calculations across entire datasets using optimized arrays. This approach, known as vectorized computation, allows operations to run significantly faster, especially when working with hundreds of thousands or millions of records.
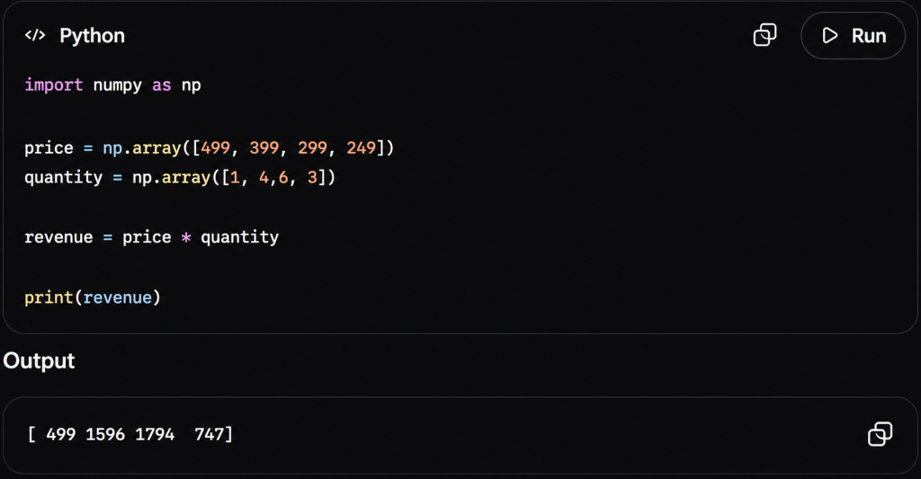
For example, suppose we want to calculate revenue generated from every order. Instead of writing formulas for thousands of rows.
NumPy can calculate everything in seconds.Simple, Fast, Scalable.Whether the dataset has 4 rows or 4 million rows, the logic remains the same.
Numpy
Pandas – The Analyst’s Best Friend
While NumPy powers calculations, Pandas provides everything needed to work with real-world business data.
With Pandas , you can
- Read Excel files
- Read CSV files
- Connect to SQL databases
- Clean messy datasets
- Merge reports
- Remove duplicates
- Handle missing values
- Create summary reports
All with surprisingly little code.
The Impact of using NumPy and Pandas
Learning NumPy and Pandas wasn’t just about learning Python—it transformed the way I worked with data. By automating repetitive tasks, I spent less time preparing data and more time generating insights.
- Faster Decision-Making
When reports are generated in minutes instead of hours, business leaders can react to market changes quickly. Whether it’s identifying a drop in conversions, monitoring campaign performance, or tracking sales trends, timely insights enable proactive decisions instead of reactive ones. - Improved Data Accuracy
Manual data preparation often introduces inconsistencies such as duplicate records, incorrect formulas, or missing values. Automated scripts ensure that the same validation and transformation rules are applied every time, resulting in more reliable and trustworthy reports.
- Cost Optimization
Automation reduces the effort required to generate recurring reports and minimizes operational inefficiencies. Marketing teams can quickly identify underperforming campaigns, finance teams can monitor revenue trends in near real time, and operations teams can detect anomalies before they become costly issues.
A practical Example
Let’s say every morning you receive three reports.
Report 1: Google Analytics
| User | Sessions |
| Ravi | 4 |
| Aman | 6 |
Report 2: CRM
| User | Sessions |
| Ravi | 4 |
| Aman | 6 |
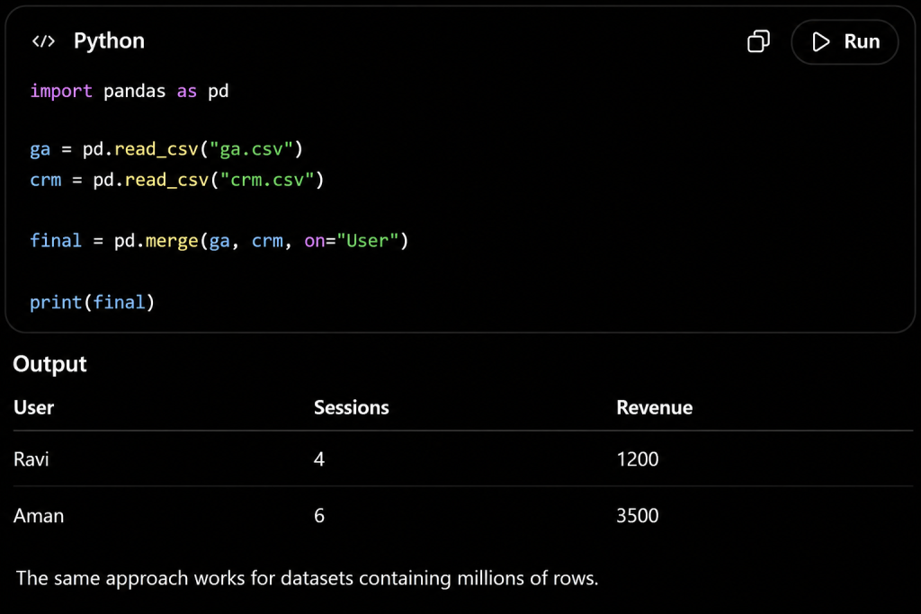
Instead of manually doing VLOOKUP. Pandas merges everything instantly.
Pandas
API Integration
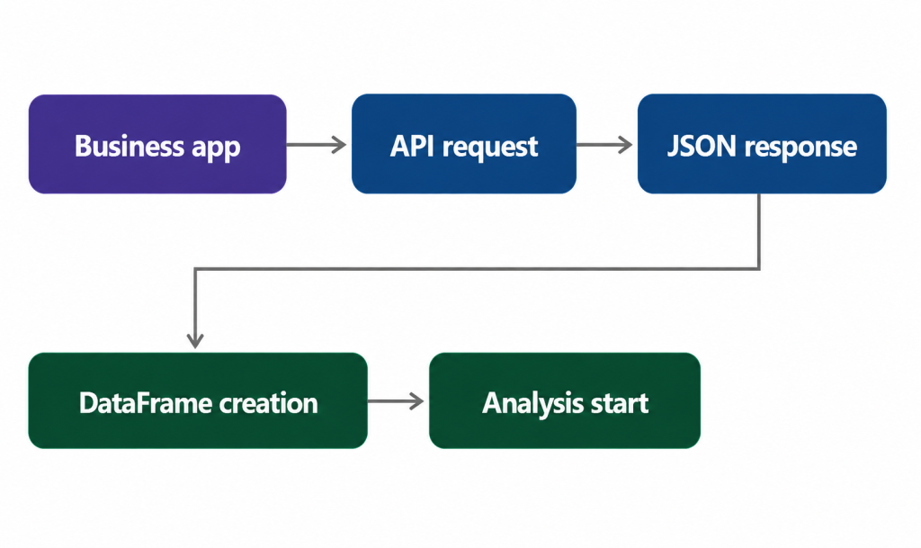
An API acts as a bridge between two systems. Instead of downloading reports manually, Python sends a request to the platform, retrieves the required data automatically, processes it using NumPy and Pandas, and makes it available for dashboards or further analysis. Main keys for API integration are “Key” and “API”.
Automated Reporting
Flow
Automated Reporting
Businesses rely on timely reports to monitor performance, identify trends, and make informed decisions. However, manually downloading data, cleaning spreadsheets, updating dashboards, and emailing reports every day is repetitive, time-consuming, and prone to human error.
Python transforms this process by automating the entire reporting workflow.
Instead of manually performing the same tasks every morning, a Python script can retrieve data from multiple systems, process it, generate reports, and distribute them automatically. No human intervention.
Automated Reporting
Imagine you’re creating the same sales report every morning, or we have to get the direct data from one database like MongoDB which is a non-sql DB, now we have to migrate the required data to a SQL cloud like Bigquery.
Every day you:
- Download data from Google Analytics.
- Export sales data from BigQuery.
- Clean the data.
- Merge both files.
- Calculate KPIs.
- Update Power BI.
It’s the same process every single day.
Instead of repeating these steps manually, you can write a Python script once. That script becomes a reusable data pipeline.
Cleaning Data Becomes Surprisingly Easy
Every analyst has seen data like this.
- Null Values
- Null Values
- Wrong dates
- Blank values
- Mixed text formats
- Undefined
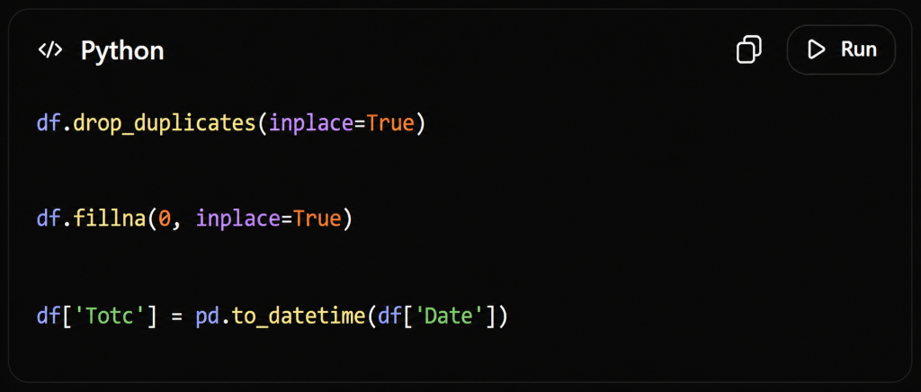
Normally. Cleaning this takes hours. Let’s see the power of Mr. Pandas. Three lines. Clean dataset. Ready for analysis. !! Kudos to Pandas
Real-World Use Case: E-commerce Reporting
Consider an e-commerce company running campaigns across multiple marketing channels.
Every day, analysts need to combine data from:
- Google Analytics
- CRM systems
- Sales databases
- Advertising platforms
Without automation, this process involves downloading multiple reports, cleaning each dataset, merging files, calculating KPIs, and updating dashboards manually.
By using NumPy and Pandas, the workflow becomes much more efficient.
Data from different sources can be consolidated automatically, business metrics such as Revenue, Conversion Rate, and Average Order Value can be calculated consistently, and dashboards can refresh with minimal manual intervention.
As a result, stakeholders receive accurate insights faster, allowing them to respond quickly to changing business conditions.
Conclusion
Learning Python didn’t replace Excel in my daily work, it just complemented it.
Excel remains an excellent tool for quick analysis, ad hoc calculations, and small datasets. However, as data volumes increase and reporting requirements become more complex, relying solely on spreadsheets can limit both productivity and scalability.
The true value of NumPy and Pandas isn’t just faster code, it’s enabling businesses to make faster, smarter, and more confident decisions. By reducing manual effort and improving data reliability, these tools allow organizations to spend less time preparing data and more time creating value from it.