Amazon CloudFront Allow us to monitor our website or application using CloudWatch.Using metrics, we can specify a time interval of as little as one minute for time periods in the previous two weeks.
Following cloudwatch metrics are provided by CloudFront.
1. Requests – Number of requests for all HTTP methods and for both HTTP and HTTPS requests
2. BytesDownloaded – Number of bytes downloaded by viewers for GET, HEAD, and OPTIONS requests
3. BytesUploaded – Number of bytes uploaded to your origin with CloudFront using POST and PUT requests
4. TotalErrorRate – Percentage of all requests for which the HTTP status code is 4xx or 5xx
5. 4xxErrorRate – Percentage of all requests for which the HTTP status code is 4xx
6. 5xxErrorRate – Percentage of all requests for which the HTTP status code is 5xx
Follow the steps to create CloudWatch alerts for CloudFront
- Login to CloudFront console and by clicking select Monitoring and Alarms tab from navigation panel.
- From left most corner click over the Create Alarms.
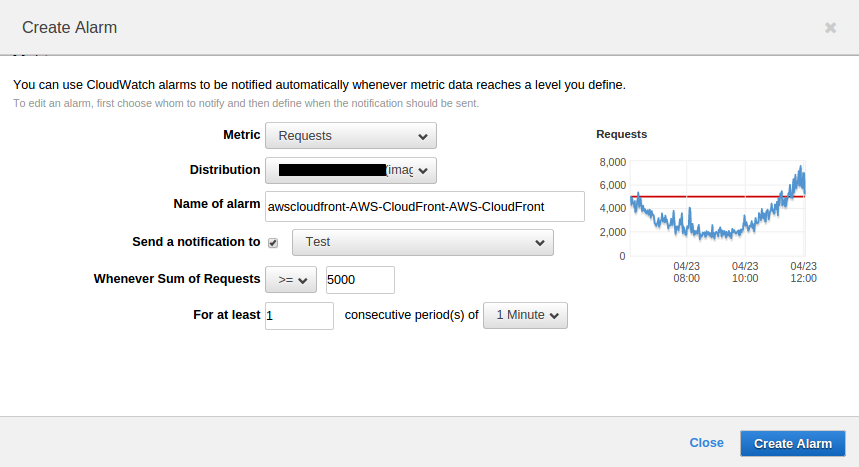
- In Create Alarm dialog box specify following values(As seen in Screenshot)
- Distribution : Choose the CloudFront distribution for which you want to create the alarm.
- Metrics : Choose the metric for which you want to create the alarm
- Name of alarm
- Send notification to (Choose the existing Amazon SNS topic that you want to send notification)
- Whenever metric operator value For at least x consecutive periods of time period
After creating the alert,whenever the threshold cross the specific value we will receive the alert over the subscribed email address.
Reference: http://docs.aws.amazon.com/AmazonCloudWatch/latest/DeveloperGuide/cloudfront-metrics-dimensions.html
Thanks Prashant Sharma