


Can You Trust the Report Sitting in Your Inbox?
Every marketing team knows this morning.
A report is due. Someone is jumping between five platforms, exporting numbers by hand, pasting them into a sheet, hoping last week’s formula changes didn’t break anything. It goes out late. There’s always a small doubt: did a number land in the wrong row?
Meanwhile, a campaign manager is waiting on that report to decide whether to pause a losing ad set. Every hour the report is late is an hour of budget still going out the door.
This was never about effort. It was the process.
Manual reporting holds up fine at a small scale. Add a few more platforms and a few more sheets, and it starts to crack. Every copy-paste is one more place for something to go wrong.
Why Does This Keep Happening?
Reporting isn’t a one-time project. It repeats every single week, and repetition is where things wear thin.
A missed call isn’t just untidy; it costs money. Someone forgets an export on a busy Tuesday. A mapping error breaks a formula three tabs deep. Three people edit the same file at once, and now nobody trusts the file at all.
None of this looks serious in isolation. It compounds as the team grows.
The Sheet That Updates Itself
Most teams treat a spreadsheet as something static: one person updates it, someone else reads it, and the handoff eventually slips.
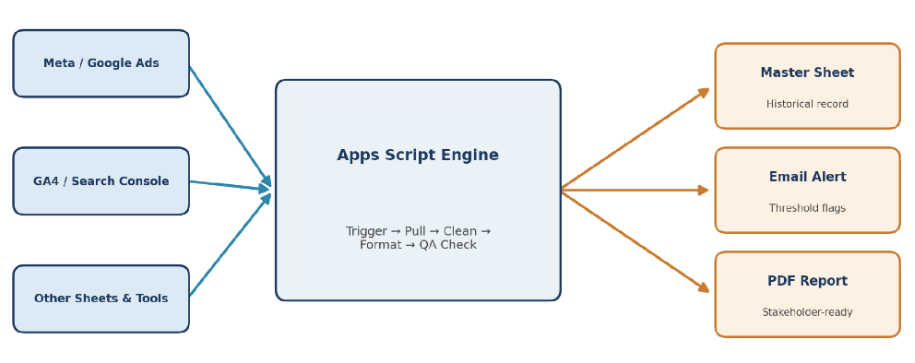
Google Apps Script changes that. The sheet stops waiting for a person and starts running itself; pulling data, cleaning it, formatting it, and sending it out, all on a schedule.
Real Results: Two Case Studies
This isn’t theoretical. Here’s what it looks like when it’s actually running.
Case Study 1: A Performance Marketing Team – Daily Campaign Reporting
The client wanted an easier way to monitor Meta Ads and Google Ads performance without manually checking both platforms every morning. We built an automation that pulls campaign-level data into a single Google Sheet, updates it daily, flags underperforming campaigns based on predefined thresholds, and automatically emails a performance summary to the team.
The result is a faster and more reliable reporting process. The team no longer spends time collecting daily numbers manually, campaign issues are spotted sooner, and the master sheet stays accurate without copy-paste work, making reporting a seamless part of the daily workflow.
Case Study 2: A Streaming & Entertainment Platform – Monthly GA4 and GSC Reporting
The client needed a faster, more reliable way to prepare a monthly report using data from GA4 and Google Search Console. Instead of manually downloading and sorting through large exports, we built an automated workflow that pulls only the required metrics and dimensions, compiles the report, and emails it to stakeholders before the 2nd of every month.
The result is a reporting process that’s consistent and dependable. Reports are always delivered on time, manual effort has been eliminated, and the same reporting logic is applied every month, making the data easier to trust and the process much easier to maintain.
Before and After
It’s easier to see the shift side by side:
| Before (Manual) | After (Automated) | |
| Data pulling | Log into 3–5 platforms and export by hand | The script pulls every source on its own, overnight |
| Timing | The report lands mid-morning, sometimes later | Sitting in the inbox by 6:00 AM |
| Data quality | Duplicates, broken formulas, stray #N/A errors | Cleaned and validated before anyone sees it |
| Formatting | Colors and borders fixed by hand, every day | Applied automatically, every time |
| Alerts | Underperformance goes unnoticed for a day or two | Flagged the moment a metric crosses a threshold |
| Team’s time | 1–2 hours a day building the report | Under 10 minutes reviewing it |
That last row is really the whole point. The bottleneck was never the data; it was the doubt.
How It Actually Runs
Once it’s set up, the script follows the same five steps every single time:

- Trigger fires – A time-driven trigger kicks things off; no one needs to be online.
- Pull data – It opens the source spreadsheets or platforms and grabs the ranges it needs.
- Clean & format – Duplicates removed, dates standardized, #N/A errors replaced, rows styled.
- QA check – Confirms date ranges, sources, and recipient lists are correct before anyone sees it.
- Deliver – Cross a threshold? Alert fires. Otherwise, the PDF lands in the inbox.
What This Feels Like for the Team
The biggest benefit isn’t just automation; it’s how much simpler the reporting process becomes.
Instead of spending time pulling data, updating spreadsheets, or worrying about broken formulas, the reports are ready when the team needs them. Manual work is reduced, errors are less likely, and the reporting process becomes far more reliable.
With the repetitive tasks taken care of, analysts can focus on what really matters: understanding the data, spotting trends, and making better decisions. Reporting shifts from being a time-consuming task to a process that runs quietly in the background.
Things to Keep in Mind with Google Apps Script
Google Apps Script is a great choice for automating reporting, but it does have a few practical limitations.
- Execution limits: Scripts have runtime and API quota limits, so large datasets or complex workflows may need to be split into smaller tasks.
- Ongoing maintenance: APIs and data structures can change over time, so occasional updates are needed to keep automations running smoothly.
- Accurate setup matters: Mapping metrics, dimensions, and business rules correctly is essential for reliable reporting.
- Documentation is important: Well-documented code makes it easier for others to understand, maintain, and extend the solution.With these considerations in mind, Google Apps Script remains a flexible, cost-effective, and powerful tool for building reliable reporting automations.
Conclusion
A lack of effort rarely causes late reports; they’re usually the result of a process that depends too heavily on manual work.
By automating repetitive tasks like data collection, mapping, and reporting, teams can focus on what really matters: understanding the data and taking action.
The benefits are clear:
- Faster decisions: Underperforming campaigns can be identified the same day, helping teams optimize budgets before unnecessary spend adds up.
- Reliable reporting: Reports are built using the same logic and data every time, reducing manual errors and increasing confidence in the numbers.
- More time for analysis: Instead of spending hours downloading, cleaning, and combining data, analysts can focus on uncovering insights and making recommendations.
The biggest value of automation isn’t just saving time; it’s creating a reporting process that’s consistent, dependable, and allows teams to spend more time making decisions instead of preparing reports.