


Introduction
Every Friday, before sending the weekly status report, I repeated the same routine: open the backlog, scan 60+ rows, identify what changed, extract blockers, update the RAID log, and reformat everything into a professional delivery report.
It took 60–90 minutes every week, and almost none of it required real thinking – it was simply translating data into a report.
I run delivery for a Kanban-based digital project at TOTHENEW for a telecom client. The backlog lives in Google Sheets. Not Jira, not any managed project tool — because that is what the client’s workflow supports. This is the story of how I automated that entire reporting pipeline without buying a single new tool, without a paid API, and without involving the engineering team.
The Problem Nobody Talks About
There is a version of this story where someone says: “Just integrate Jira with a reporting tool and automate the whole thing.”
That advice is correct. If you already have Jira.
For the rest of us running delivery on Google Sheets because the client doesn’t use Jira, because procurement won’t approve a new tool mid-engagement, because the team is lean — that advice doesn’t land. Most real-world delivery setups are messier than what gets written about. The PM is still expected to produce professional reporting anyway.
That gap, between the textbook setup and the real one, is exactly where this approach lives.
The Setup
The backlog is a Google Sheet with two tabs: Portal (website) and MAPP (mobile app). Every task has a status, a dependency/RAID column, a risk level, and one column I introduced: AI_Flag.
Throughout the week, as tasks move, I tag the relevant rows with a W in the AI_Flag column. That tag is the only manual input the entire system depends on.
The W-flag was the key design decision. Kanban has no sprint boundary, so there is no natural “this week’s work” filter. Date hygiene on a live backlog is inconsistent. Tasks get updated at odd times, some never dated. Rather than building brittle date-parsing logic, I made the filter deliberate. I tag what’s relevant throughout the week, and the script processes only what’s tagged.
What I Built
At the core of the solution is a Python script (weekly_report_generator.py). When I run it, it reads the live backlog, validates the data, categorises every tagged task, generates the HTML report, creates a Gmail draft, and finally produces a verification log so I can review everything before sending it.
- A fully formatted HTML delivery report with a visual chart, task breakdown by status (Completed / In Progress / In UAT / On Hold), RAID log, active blockers table, and a “Coming Up” pipeline section.
- A filter output log — a plain-text verification layer so I can confirm the data before anything goes to the client.
- A Gmail draft, created automatically. No copy-paste required.
Columns are matched by name with aliases (raid_flag, dependency, and dependencies all resolve to the same field), and status values are normalised so “Prod Deployed”, “Done”, and “Completed” all land in the same bucket.
A validation checkpoint then confirms that no W-flagged row was silently dropped. If something doesn’t match, the script stops and highlights exactly what failed.
Rather than building custom integrations between each step, I use an LLM to orchestrate the workflow – retrieving the latest backlog, running the reporting script, presenting the outputs for review, and preparing the Gmail draft. The Python script still owns all business logic and data processing.
The result is a consistent, validated report that’s ready for a final human review. Here’s what the generated report looks like:
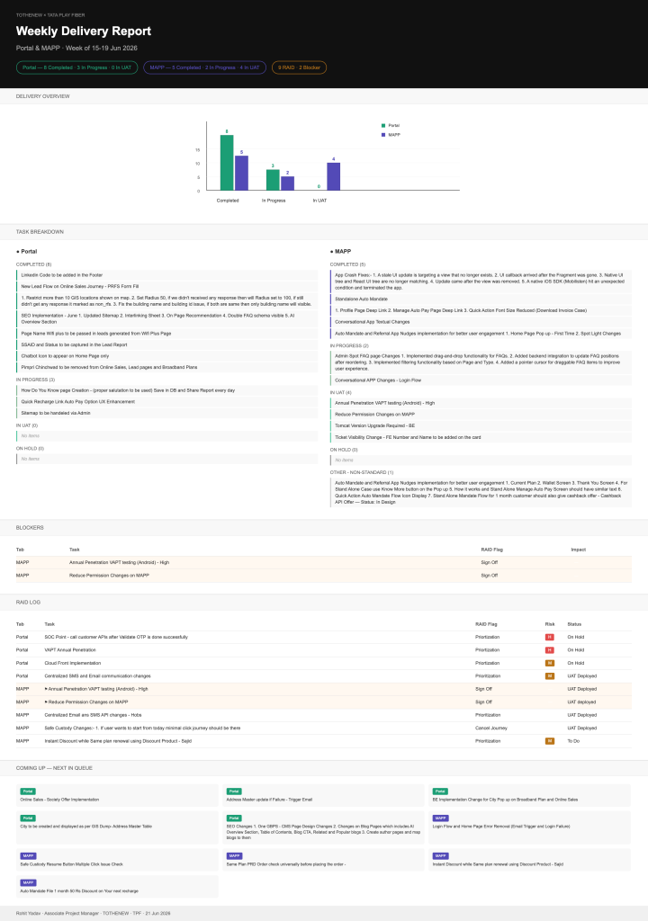
Sample Generated Report
The report is generated in seconds, but the final review remains intentional. That balance between automation and oversight is what makes the workflow reliable.
Why Not Just Use Jira? Why Not Fully Automate?
Both fair questions.
On Jira: it’s excellent when the whole project ecosystem is built around it. When the client owns a different workflow, you adapt. Google Sheets is not a compromise. It’s a practical choice made under real constraints.
On Full Automation: I could have automated more. Auto-send the email. Schedule the report to run without me. I didn’t, deliberately. A report sent without someone reviewing it is a liability, not an efficiency. Go-live calls, escalation decisions, and anything that touches the client relationship need a human in the loop. What I automated was the compilation, the mechanical process of transforming project data into a report. The judgment stayed with me.
That boundary was a design choice, not a gap.
Zero Additional Cost
The entire stack runs on tools already in use:
- Google Sheets — already the project’s backlog source.
- Python — open source, no licence cost.
- LLM (Large Language Model) — used as the AI orchestration layer across the delivery workflow.
- Gmail + Google Drive connector — native integration, no third-party middleware.
Because every component was already part of our existing toolset, the only investment was the initial setup. From then on, the time savings became a recurring benefit every Friday.
Although I built this for a telecom delivery project, the same approach can be applied to any team managing work in spreadsheets – whether for product delivery, operations, or support.
Key Takeaways
- Design your filter convention before anything else. Decide how the system knows what “this week” means. It needs to be simple enough that you’ll actually maintain it without friction.
- Separate data, logic, and output. The sheet is the data layer. The script is the logic layer. The LLM is the orchestration layer. Each can be updated independently.
- Build validation before you trust the output. Silent failures (data dropped without any error message) are worse than loud ones. The checkpoint saved me more than once.
- Write column resolution with aliases. Real sheets have inconsistencies. Ten minutes of alias mapping prevents months of breakage.
- Don’t wait for the ideal setup. If your client is on Google Sheets, build for Google Sheets. The constraint is not the problem — it’s the starting point.
The Outcome
- Before: 60–90 minutes every Friday, inconsistent formatting, no structured RAID log, no blockers table.
- After: about 5 minutes to run the workflow, review the output, and send the report. The report is more thorough and consistent than the one I produced manually. The client gets more signal and the format never varies.
That consistency matters more than I expected. A report that lands every Friday in the same structure, without fail, builds a kind of trust that a better-written but irregular report never quite does.
The gap between “AI can automate delivery work” and “I actually automated my delivery work” is mostly a gap of specificity. The tools exist. The approach isn’t complex. It just requires looking at the exact task you repeat every week and asking: Which parts are mechanical, and which parts actually need me?
AI didn’t replace my role as a delivery manager. It removed the repetitive work that added little value, leaving me more time for the conversations, decisions, and risks that actually matter. That’s where I think AI delivers its greatest value – not replacing judgment, but giving us more time to use it.