


When the Dashboard Couldn’t Keep Up
I was working on a project where the team wanted to monitor website activity as soon as a campaign went live. They didn’t need detailed attribution reports yet – they simply wanted to know whether users were arriving on the site, key events were firing, and registrations were starting to come in.
At first, I assumed GA4’s Realtime report would solve the problem. But the team primarily relied on Looker Studio for reporting, and asking stakeholders to switch between dashboards during a campaign launch wasn’t ideal.
That’s when I started asking a different question:
Could I build a lightweight solution that brought near real-time GA4 data into the existing dashboard without introducing another reporting platform or complex infrastructure?
That question shaped every decision that followed.
Exploring Options
Before diving into development, I spent some time exploring the different ways this problem could be solved. Some of the approaches relied on manual exports, others used BigQuery and the cloud to build a much more sophisticated reporting pipeline.
| Approach | Best For | Considerations |
| Manual exports | Small reports | Requires frequent manual updates |
| BigQuery + Cloud Services | Enterprise-scale analytics | Powerful but requires additional infrastructure and maintenance |
| Google Apps Script + GA4 API | Lightweight automation | Simple to implement, cost-effective, and integrates seamlessly with Google Workspace |
Manual exports were easy to eliminate – they solved the reporting problem but not the automation problem. If someone still had to download and refresh data every few minutes, the dashboard wasn’t really “real-time”.
I also considered using BigQuery and cloud-based pipelines. These options were powerful, but felt like more than I really needed. The goal wasn’t to build a large-scale analytics platform, just a dashboard that updated itself every few minutes.
That made me rethink where I was going.
Instead of asking, “What’s the most robust solution?”, I started asking, “What’s the simplest solution that solves the problem reliably?”
Once I had narrowed down what I actually needed, the choice became fairly obvious: Google Apps Script and the GA4 Realtime Data API.
Why GA4 Realtime Data API?
The more I explored the Realtime Data API, the more I realized it was designed for exactly this kind of requirement.
Unlike standard GA4 reports, which focus on historical analysis and attribution, the Realtime Data API is designed to answer a much simpler question:
What’s happening on the website right now?
It provides access to metrics and dimensions such as active users, event counts, device category, country, and event name, making it ideal for operational monitoring.
Another advantage of using the Realtime Data API was flexibility. Instead of relying on GA4’s predefined Realtime report, I could decide exactly which metrics and dimensions to retrieve and present them in a dashboard tailored to the team’s needs. This made it possible to monitor the KPIs that mattered most in one place, alongside the historical reporting they were already using in Looker Studio.
Designing for Simplicity
Once I decided to stay within the Google ecosystem, I wanted to keep the solution as simple as possible.
Before writing any code, I defined a few principles for myself:
- The refresh should happen automatically
- The solution should be easy to understand and maintain
- It should work with tools the team was already familiar with
- It shouldn’t introduce unnecessary infrastructure just to solve a relatively small problem
Those principles naturally led me to a combination of the GA4 Realtime Data API, Google Apps Script, Google Sheets, and Looker Studio.
The operational steps are surprisingly simple.
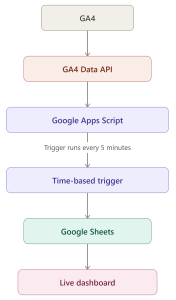
As shown above, Google Apps Script acts as the bridge between GA4 and Looker Studio. Every five minutes, a scheduled trigger fetches the latest metrics from the GA4 Realtime Data API and appends them to a Google Sheet. I used Google Sheets as the intermediary because it integrates seamlessly with Looker Studio, allowing the dashboard to refresh automatically without adding another database or reporting platform.
Things to Keep in Mind
Google Apps Script was a great fit for this project, but it’s worth understanding its limitations before using it in production.
- Execution time: Each script execution has a maximum runtime of 6 minutes, making it better suited for lightweight data retrieval than long-running processes.
- Daily quotas: Services such as UrlFetchApp have daily usage limits, so very frequent API calls or large-scale implementations may require a different approach.
- Trigger quotas: Time-driven triggers also have daily execution limits, which are sufficient for many reporting use cases but should be considered as data volume and refresh frequency grow.
- Scalability: Apps Script works well for lightweight automation, but if you’re processing large datasets or need high-frequency updates, solutions like Cloud Functions or other cloud-based architectures may be more appropriate.
The Biggest Lesson Wasn’t Technical
One thing I found interesting while working on this project was how easy it is to equate “real-time” with “complex”.
When we hear real-time reporting, it’s natural to think about streaming pipelines, cloud infrastructure, and enterprise-scale architectures. I initially explored some of those possibilities too.
But as I stepped back and focused on the actual business requirement, I realized none of that complexity was necessary.
The goal wasn’t to process millions of events every second. Rather to give stakeholders a dashboard that refreshes frequently enough to support timely decision-making.
Sometimes, we don’t need the most advanced architecture – we need the most appropriate one.
For this use case, Google Apps Script provided exactly the right balance between functionality, simplicity, and maintenance.
The Impact
Although the project started as a way to automate data refreshes, the benefits extended much further.
During campaign launches, the team no longer had to wait for standard reports before getting an initial sense of what was happening.
Within minutes, they could see whether active users were increasing, whether key events such as CTA clicks were being triggered, and whether registrations were starting to come through.
It also made it easier to validate tracking implementations. If an expected event wasn’t appearing shortly after launch, the issue could be investigated immediately instead of being discovered hours later.
The dashboard also removed repetitive manual work. There was no need to export fresh data throughout the day or repeatedly refresh reports.
Instead, analysts could spend more time interpreting the data and less time collecting it.
The biggest benefit wasn’t that the dashboard refreshed every five minutes.
It was that the team had immediate visibility into website activity during the moments when that visibility mattered most.
Conclusion
Building this solution taught me that near real-time reporting doesn’t necessarily require a complex architecture.
By combining the GA4 Realtime Data API with Google Apps Script, Google Sheets, and Looker Studio, I was able to build a lightweight workflow that keeps dashboards updated automatically with minimal maintenance and without introducing additional reporting platforms.
What started as a request for a faster dashboard ultimately became a reminder that good engineering is about making thoughtful trade-offs. Sometimes, the best solution isn’t the one with the most moving parts – it’s the one that’s simple, reliable, and fits the problem you’re trying to solve.