
Introduction
The right decision isn’t a guess - it’s in the metrics. Let's understand “How”?
In the fast-paced, goal-oriented project environments of today, intuition is insufficient. Experience is important, but what really sets reactive project managers apart from strategic leaders is data-driven decision-making.
Throughout the project lifecycle, this guide explains how a project manager (PM) can use metrics to make better, quicker, and more assured decisions. Before getting into how to make data or metric driven decisions, lets understand what is a data driven decision and why is it important?
Data-driven decision-making (DDDM) is the process of making choices based on actual data rather than intuition, guesswork, or personal experience alone.
What Kind of Decisions Can a Project Manager Make Using Data?
For a project manager, the right data can be a best friend in driving project success. Below are key responsibilities of a PM and how data-driven decisions help in each area:
- Aligning project goals with measurable outcomes
- Ensuring scope, cost, and timelines are realistic and controlled
- Improving stakeholder communication with evidence-backed updates
- Detecting risks early and reprioritizing resources effectively
- Optimizing quality and user adoption with clear benchmarks
To understand better, the metrics a Project Manager should be tracking in each phase of project delivery:
| Decision Area | Decision Example | Data Used | Impact |
|---|---|---|---|
| Project Planning & Estimation | Choosing a realistic project timeline | - Historical velocity - Average task duration - Past project overruns | - Prevents over-committing - Improves predictability |
| Resource Allocation | Assigning the right number of developers/testers | - Resource utilization reports - Skill matrix - Workload distribution | - Avoids bottlenecks - Ensures balanced workloads |
| Risk Management | Prioritizing risks for mitigation | - Probability/impact matrices - Defect density trends - RAID Registers | - Early intervention on critical risks |
| Budget & Cost Control | Deciding whether to continue or pause a project phase | - Earned Value Management metrics (CPI, SPI) - Actual vs planned expenditure | - Prevents cost overruns - Keeps financial alignment |
| Scope & Change Management | Accepting or rejecting a change request | - Change impact analysis (time, cost, quality) - Requirements traceability matrix | - Avoids scope creep - Ensures alignment with business value |
| Quality Assurance | Identifying when to release a deliverable | - Defect leakage rates - Test case pass % - UAT feedback scores | - Ensures releases meet quality benchmarks |
| Performance Monitoring | Choosing corrective actions when a project is off-track | - Burn-down/burn-up charts - Velocity trends - Bug turnaround time | - Enables proactive interventions |
| Stakeholder Engagement | Determining communication frequency and method | - Stakeholder surveys - Engagement metrics - Escalation history | - Builds trust - Reduces miscommunication |
| Post-Project Evaluation | Improving future project methodologies | - Lessons learned repository - Retrospective items - Project KPIs | - Improvement in future projects |
Types of Metrics for a Project Manager:
- Schedule Metric – Measurement of actual progress vs. the planned schedule
- Eg: SV -(Schedule Variance = Earned Value - Planned Value)
- A positive SV means you are ahead of schedule
- A negative SV means you are behind your planned schedule
- SPI -Schedule Performance Index= SPI = EV / PV
- Eg: SV -(Schedule Variance = Earned Value - Planned Value)
- Cost Metric – Measurement of planned vs. actual cost of implementation
- -CV - Cost Variance = Planned Cost - Actual Cost
- Positive CV is you are under budget
- Negative CV is you are over budget
- CPI - Cost Performance Index- CPI = Planned Value / Actual Cost
- -CV - Cost Variance = Planned Cost - Actual Cost
- Quality Metric – Defines how well your product meets the planned quality
- Defect Density = No. of defects / Lines of code
- Customer Satisfaction = Happiness percentage received in a product survey
- Risk Metric measure used to identify, assess, and track risks in a project, business process, or organization. It helps decision-makers understand the likelihood, impact, and exposure of risks so they can be managed effectively.
- RAID log
- Impact / severity
- Issue Resolution Rate
- Probability of risk occurrence
How to Use Metrics to Drive Decision-Making
Identify What Matters Most
Not all metrics are created equal. Align your metrics with:
- Project goals
- Stakeholder expectations
- Business value
Example: New Product Development Project (Mobile App Launch)
- Project goals:
- Deliver a high-quality mobile app within 6 months
- Ensure adoption by at least 10,000 active users in the first quarter after launch
- Key Metrics Chosen:
- Schedule Variance (SV) measures whether the project is on track for a timely release
- Defect Density tracks the quality of features delivered
- Cost Performance Index (CPI) ensures that costs stay under control
- Monthly Active Users (MAU) → Measures product stickiness and revenue potential
Establish a Regular Reporting Cadence
Use dashboards or WSRs (Weekly Status Reports) to:
- Track progress
- Spot trends
- Communicate insights clearly
Example: ERP Implementation Project
- Track Project Progress:
- Dashboard Metric: % completed modules (Finance 80%, HR 60%, Procurement 40%)
- WSR Content: “This week, we finished HR data migration, which is 60% overall. The Finance module is on track to complete UAT by next Friday.”a migration (60% overall). Finance module is on track to finish UAT by next Friday”
- Look out for Trends:
- Dashboard Metric: Defects found vs. resolved (trend line week over week)
- WSR Content: “Defect closure rate improved from 65% to 78% this week. However, recurring integration issues in Procurement suggest we may need extra testing cycles
- Visualisation of Dashboard:
- RAG (Red/Amber/Green) status for schedule, budget, and scope
- A burndown chart that compares planned and actual tasks
Use Metrics to Ask Better Questions
Instead of just reporting, use metrics to:
- Forecast risks
- Re-prioritize tasks
- Justify trade-offs in time, scope, or budget
Example: Project to Redesign a Website
- Estimate the Risks
- Metric: The burn-down chart indicates that the number of tasks left is not declining as quickly as anticipated
- Question Asked: “At this velocity, will we miss the launch date by 2 weeks? Should we add another front-end developer to mitigate the delay?”
- Re-prioritize Tasks
- Metric: Defect severity trend shows 70% of open defects are in the checkout/payment module
- Question Asked: “Should we reprioritize testing to focus on checkout before UI enhancements, since it directly impacts revenue?”
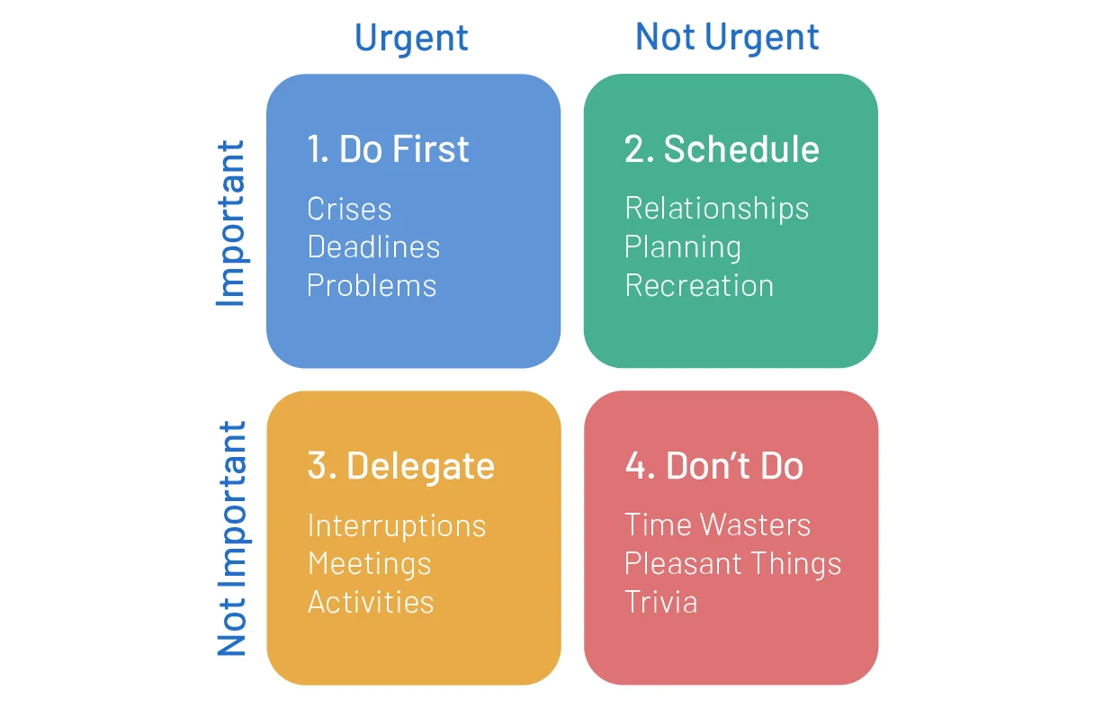
The image shown above is the Eisenhower Matrix (also called the Urgent-Important Matrix), a time management and prioritization tool. It helps people decide what tasks to focus on, schedule, delegate, or eliminate based on urgency and importance.
Justify Trade-offs in Time, Scope, or Budget
- Metric: Earned Value (CPI = 0.85, SPI = 0.9) indicates cost & schedule slippage
- Question: “Should we reduce scope (drop low-priority features) or request a budget increase?”
Benefits of Data-Driven Decision-Making in Project Management
- Forecasting & Reduces Project Risk
- When we have data upfront showing the gaps/progress, we can sense risk in much advance and mitigate it timely
- Improves Stakeholder Confidence
- Data brings transparency, and hence a real picture can always be presented to all the stakeholders leading to stakeholders trust & confidence
- Aligns team performance with business goals
- Metrics shows the areas which are to be improved, and hence tasks can be updated time to time to make the team aligned with the end goal
Tools for Tracking Metrics in Project Management
- Power BI or Tableau for visual analytics
- JIRA and Confluence for Agile metrics
- Smartsheet or MS Project for schedule and resource tracking
- Gen AI tools to summarize, analyze, and recommend based on real-time data
Common Challenges & How to Overcome Them
Every project faces roadblocks - whether it’s unclear goals, shifting priorities, or resource constraints. The key isn’t avoiding challenges but knowing how to anticipate, measure, and tackle them with the right strategies. Below are the obstacles being faced in creation & management of metrics
- Data Overload: Too many metrics can distract; focus on KPIs tied to business goals
- Lack of Stakeholder Buy-in: Use visualizations (dashboards, charts) to make data persuasive
- Tool Fragmentation: Integrate systems (JIRA, Power BI, MS Project) for consistency
- Skill Gaps: Train PMs in data literacy and use of analytics platforms
Conclusion
Data-driven project management transforms guesswork into confidence. By leveraging metrics and past performance, managers gain control over scope, time, cost, quality, and risk - delivering projects that are not only successful but predictable. Turn data into your greatest ally, and watch your team’s true potential come to life.
Let data lead the way and turn every project into a predictable success.