Introduction
Running containers on Kubernetes feels like putting your application inside a black box. Dozens of pods start and stop. Services talk to each other across namespaces. Traffic shifts, nodes drain, and somewhere in that complexity a latency spike quietly breaks your SLO.
Without proper observability, you are flying blind — reacting to symptoms instead of understanding causes. Observability in Kubernetes is not just about dashboards; it is about having enough context to ask — and answer — any question about your system without deploying new code.
This blog explores what Kubernetes observability really means, the tools that power it, and how to build a production-grade observability stack that gives your team genuine confidence.
What is Kubernetes Observability?
Observability is the ability to infer the internal state of a system from its external outputs. In Kubernetes, those outputs are metrics, logs, and traces — collectively referred to as the three pillars of observability.
Unlike traditional monitoring — which tells you when something is broken — observability tells you why it is broken. It empowers engineers to explore unknown failure modes without having to predict them in advance.
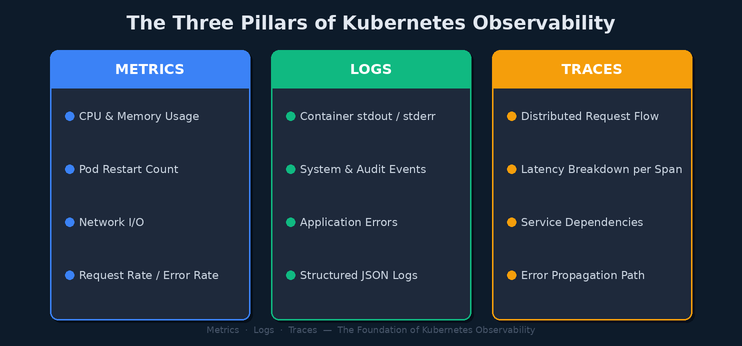
Three Pillars of Observability (Metrics · Logs · Traces)
Metrics — The Pulse of Your Cluster
Metrics are numeric measurements sampled over time. In Kubernetes, metrics fall into two categories:
- Infrastructure metrics: Node CPU, memory pressure, disk I/O, and network throughput collected by Node Exporter and kube-state-metrics.
- Application metrics: Request rates, error ratios, and response latencies exposed via the /metrics endpoint using the Prometheus client library.
Prometheus is the de facto standard for Kubernetes metrics collection. It scrapes targets on a pull-based model and stores time-series data locally. Combined with AlertManager, it triggers alerts when SLO thresholds are breached.
Logs — The Story of What Happened
Every container writes to stdout and stderr. Kubernetes captures this output and makes it queryable via kubectl logs, but raw kubectl access does not scale. Production clusters need centralized log aggregation.
The ELK Stack (Elasticsearch, Logstash, Kibana) or its lightweight alternative — Fluentd with OpenSearch — routes logs from every node in the cluster to a searchable store. Engineers can then correlate log entries across services by trace ID, pod name, or namespace.
Traces — The Map of a Request
Distributed tracing follows a request as it passes through multiple microservices. Each service adds a span — a timed operation — and those spans are assembled into a trace that shows exactly where time was spent and where errors occurred.
OpenTelemetry has emerged as the vendor-neutral standard for instrumenting applications. Traces are collected and stored in backends like Jaeger or Grafana Tempo, giving engineers a visual timeline of every transaction.
Building a Production Observability Stack
A modern Kubernetes observability stack is composed of four logical layers, each with a clear responsibility.
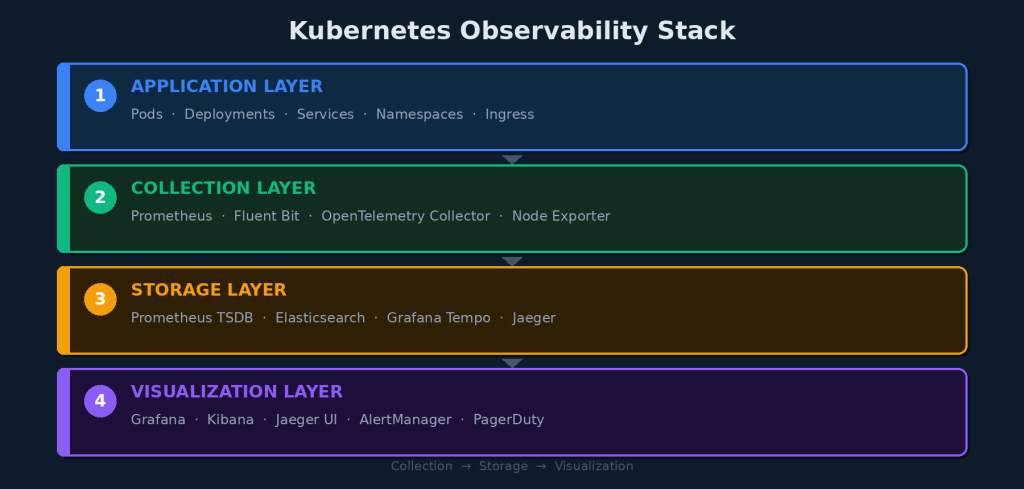
Kubernetes Observability Stack
Core Stack Components
- kube-prometheus-stack: Installs Prometheus, AlertManager, and Grafana in one Helm chart.
- Fluentd / Fluent Bit: DaemonSet log shippers that read node-level logs and forward them to Elasticsearch or OpenSearch.
- OpenTelemetry Collector: A vendor-agnostic pipeline for receiving, processing, and exporting traces and metrics.
- Grafana: Unified dashboarding layer that queries Prometheus, Loki, and Tempo from a single pane of glass.
Installing kube-prometheus-stack
Getting Prometheus and Grafana running on Kubernetes takes fewer than five commands with Helm:
$ helm repo add prometheus-community https://prometheus-community.github.io/helm-charts
$ helm install monitoring prometheus-community/kube-prometheus-stack –namespace monitoring –create-namespace
This single command deploys Prometheus with pre-built Kubernetes dashboards, alerting rules for common failure conditions, and a Grafana instance ready to query your cluster.
From Data to Action: The Observability Loop
Collecting metrics, logs, and traces is only half the story. The real value of observability is what happens when something goes wrong. A well-instrumented cluster enables a tight incident response loop.
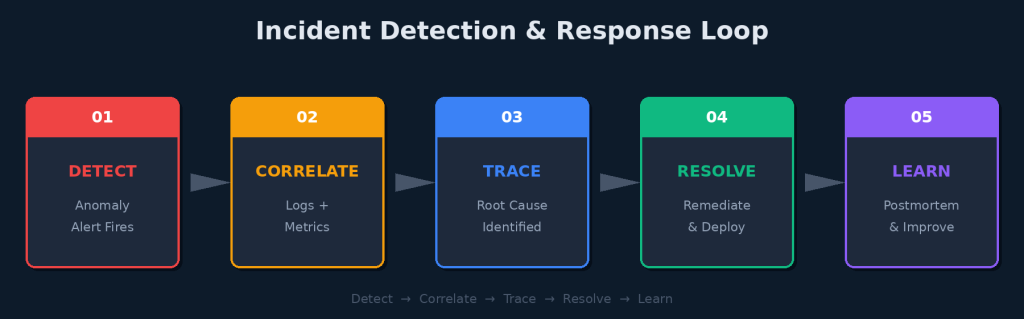
Incident Detection & Response Loop
Detect: Alert on Symptom, Not Cause
Alerting on raw metrics like CPU usage above 90% creates noise. Instead, alert on user-facing symptoms: error rate exceeding SLO budget, P99 latency above threshold, or pod crash-loop detected. These alerts mean something broke for users.
Correlate: Connect the Dots
When an alert fires, the next step is correlation. Jump from the Grafana alert to the corresponding log stream filtered by time window and namespace. Look for error messages or stack traces that appeared in the same window as the metric spike.
Trace: Find the Root Cause
Once you have a suspect service, pull the distributed trace for an affected request. The trace will show you exactly which service introduced the latency or returned the error — even if it is three hops away from the service users directly called.
Resolve and Learn
After resolution, observability data becomes the foundation of your postmortem. Instead of reconstructing what happened from memory, you replay the timeline: metrics confirm when the problem started, logs show what changed, and traces reveal which dependency failed. This turns every incident into institutional knowledge.
Best Practices for Kubernetes Observability
- Use the RED method for services: Rate, Errors, and Duration per endpoint — not just pod-level CPU.
- Apply consistent labels: environment, service, team, and version on all resources so dashboards and alerts can be filtered meaningfully.
- Set SLO-based alerts: Define error budgets and alert when burn rate threatens them, not just when a threshold is crossed.
- Adopt OpenTelemetry from the start: Avoid vendor lock-in by instrumenting with the open standard and routing to any backend.
- Limit cardinality in metrics: High-cardinality labels like user IDs in metric names will crash Prometheus. Keep dimensions low and intentional.
Conclusion
Kubernetes makes it easy to run distributed systems at scale. It also makes it easy to lose visibility into what those systems are actually doing. Without observability, every production incident becomes an archaeology project.
A well-built observability stack — anchored by Prometheus for metrics, a centralized log pipeline, and distributed tracing via OpenTelemetry — transforms your cluster from a black box into a transparent, debuggable system.
Observability is not a feature you add at the end. It is an engineering discipline you build from day one. Teams that invest in it do not just recover faster from incidents — they prevent entire classes of failures before users ever notice them.
“In the world of distributed systems, you cannot fix what you cannot see.”