
Docker Monitoring Using New Relic
In my last couple of blogs, I talked about Docker monitoring, why I would need Docker monitoring and how I can monitor Docker containers using AWS, Ruxit and Sysdig. Today, we are going to talk about another such tool which most of us already know about which also provides Docker monitoring. The tool is New Relic.
How to go about starting the New Relic monitoring for Docker:
Steps
1. Firstly you would need to update your apt sources list which can be done by using the following command:
[js]echo deb newrelic non-free >> /etc/apt/sources.list.d/newrelic.list[/js]
2. Next, is putting the authentication key for the source.list:
[js]wget -O- https://download.newrelic.com/548C16BF.gpg | apt-key add -[/js]
3. Now, just run the next two commands to install the New Relic agent.
[js]apt-get update
apt-get install newrelic-sysmond [/js]
4. After this, you need to specify the license key. You can find it in account settings which you can find from the drop-down on the right top corner:
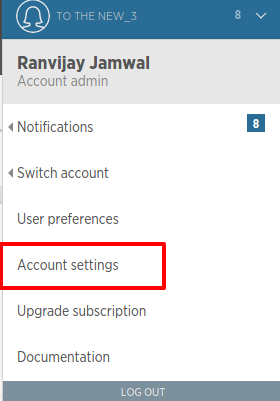
There on the right-hand side you will find the License key:
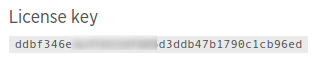
After you have your license, run the following command:
[js]nrsysmond-config –set license_key=ddbf346exxxxxxxxxxxxxx47b1790c1cb96ed[/js]
4. The New Relic agent can now be started by using the command:
[js]/etc/init.d/newrelic-sysmond start[/js]
5. One last thing that’s left is creating a docker group if it does not exist already, adding the newrelic user to that group and then restarting the Docker service and New Relic agent which can be done by the following commands in sequence:
[js]groupadd -r docker
usermod -a -G docker newrelic
service docker restart && /etc/init.d/newrelic-sysmond restart[/js]
6. Also, I have run a simple ubuntu container in my host machine using the following command:
![]()
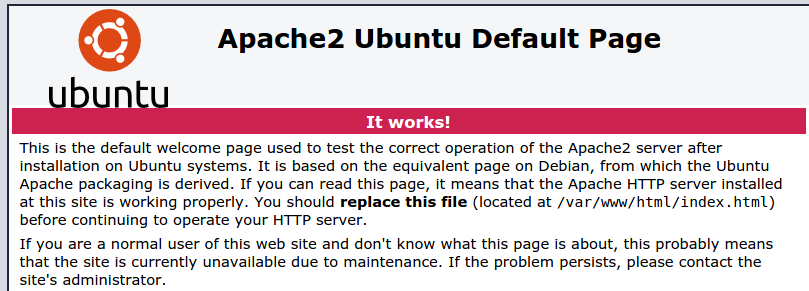
Then I have gone ahead and installed apache2 inside my container. The port mapping 80:80 maps the 80 port of my container with the port 80 of the host machine. What this means is any hit on the port 80 of the host machine will land on the port 80 of the container which should show the apache2 start page:
Let’s head on to the New Relic Console to see what insights we have now:
When you open the New Relic console, simply click on the Servers option as shown in the below image:
![]()
This will take you to the servers page where all your servers on which New Relic agent is running will be shown:
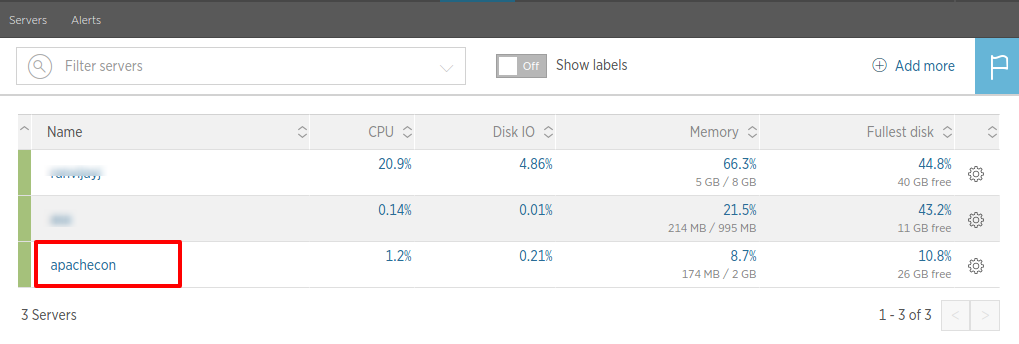
I will click on the server apachecon. This is the server inside which our container is working. After clicking on this, it will open this specific server’s monitoring. In there we can see options like Overview, Processes and Docker. We are interested in these 3 options. We will go through them one by one.
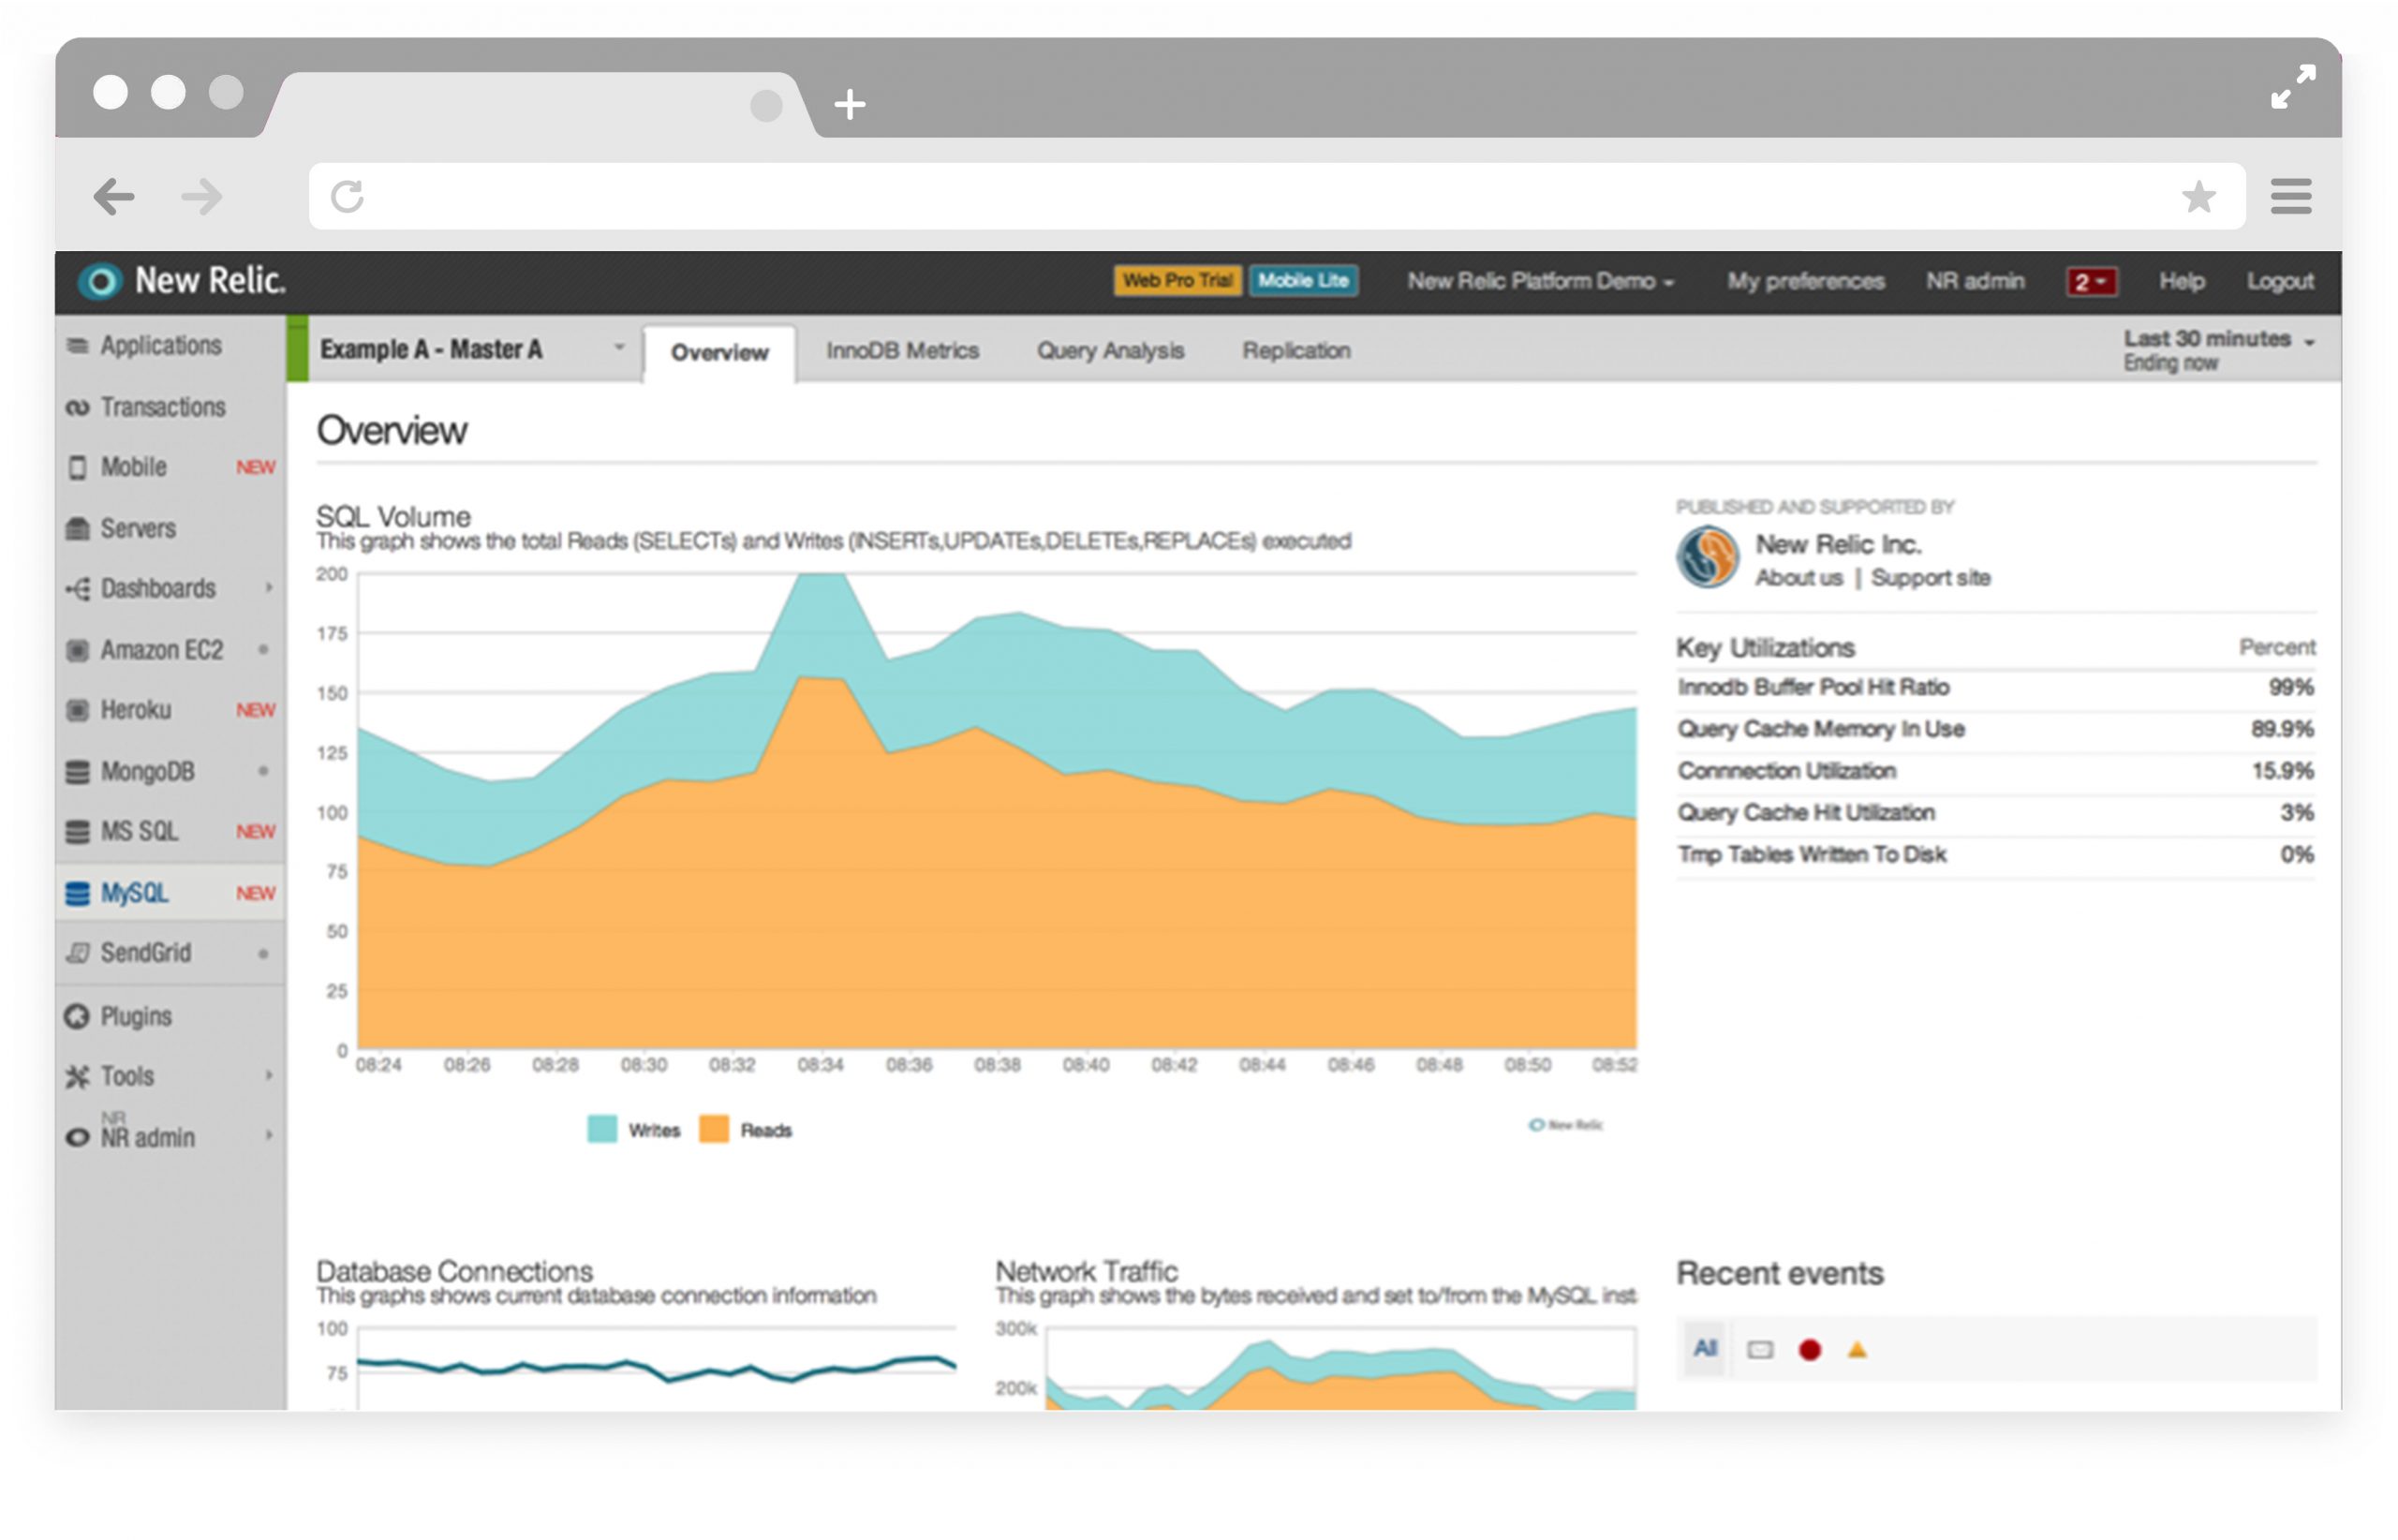
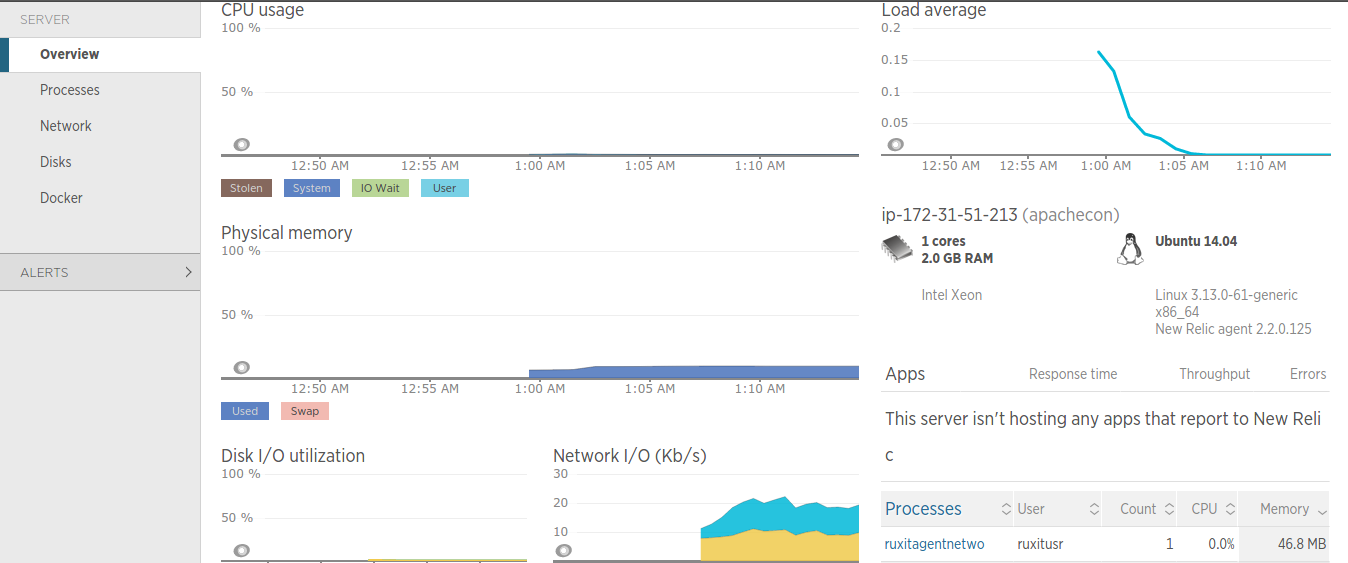
The overview gives you a brief of everything like in the image below which is self-descriptive:
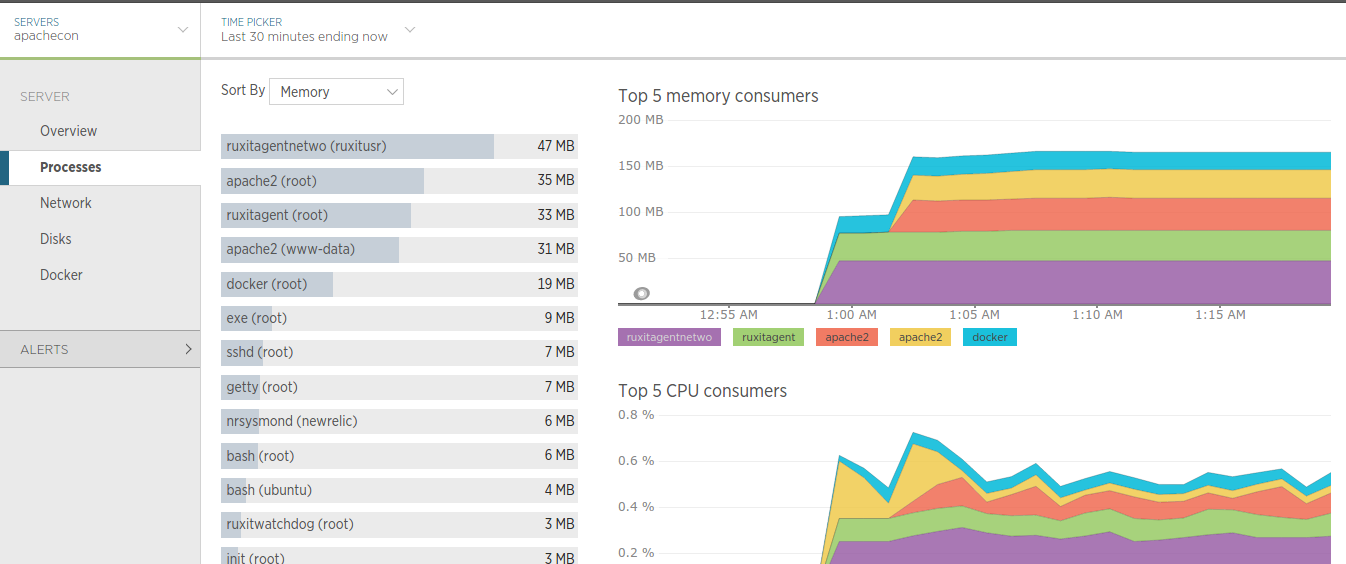
Now, Click on Processes and it will show you processes based on memory usage:
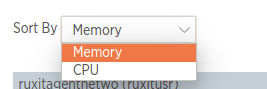
If you wish to list processes based on CPU:
Let’s now, head on to the Docker option and see what New Relic has for us. If you simple click on Docker it gives you a combined graph of all the containers:
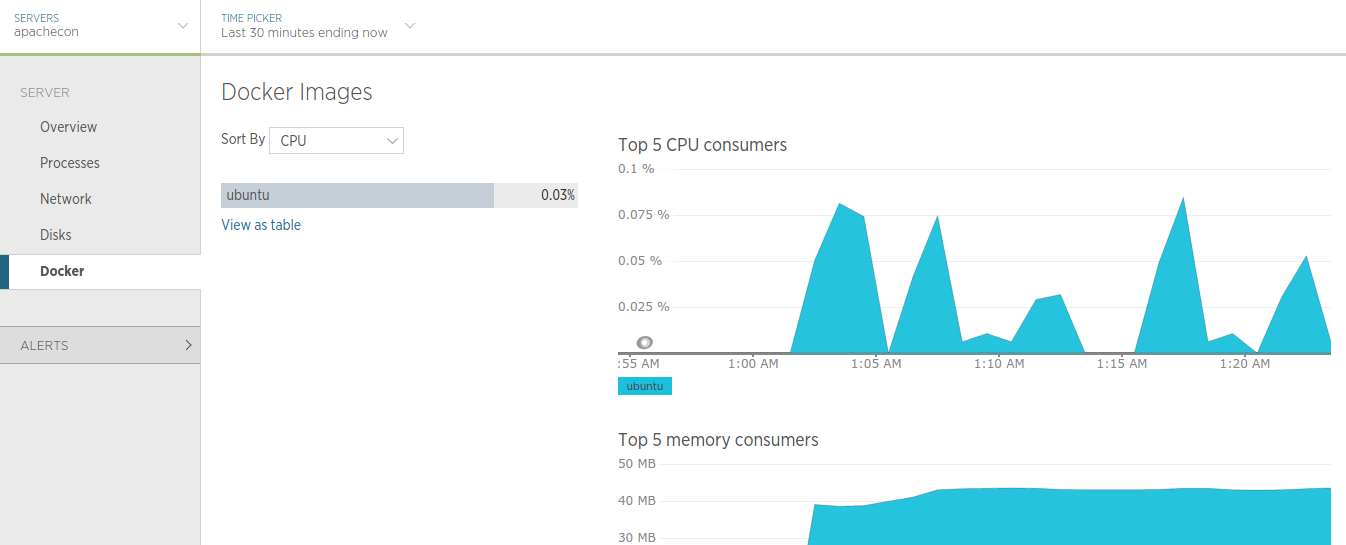
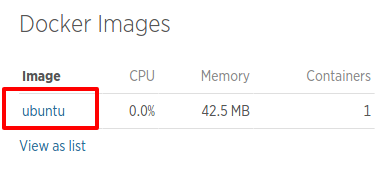
New Relic shows containers as a part of the image they were run. You can also view this as a table. So, it wont show you the container name here, rather show you the image name and now, if you click on the image name:
It shows you:
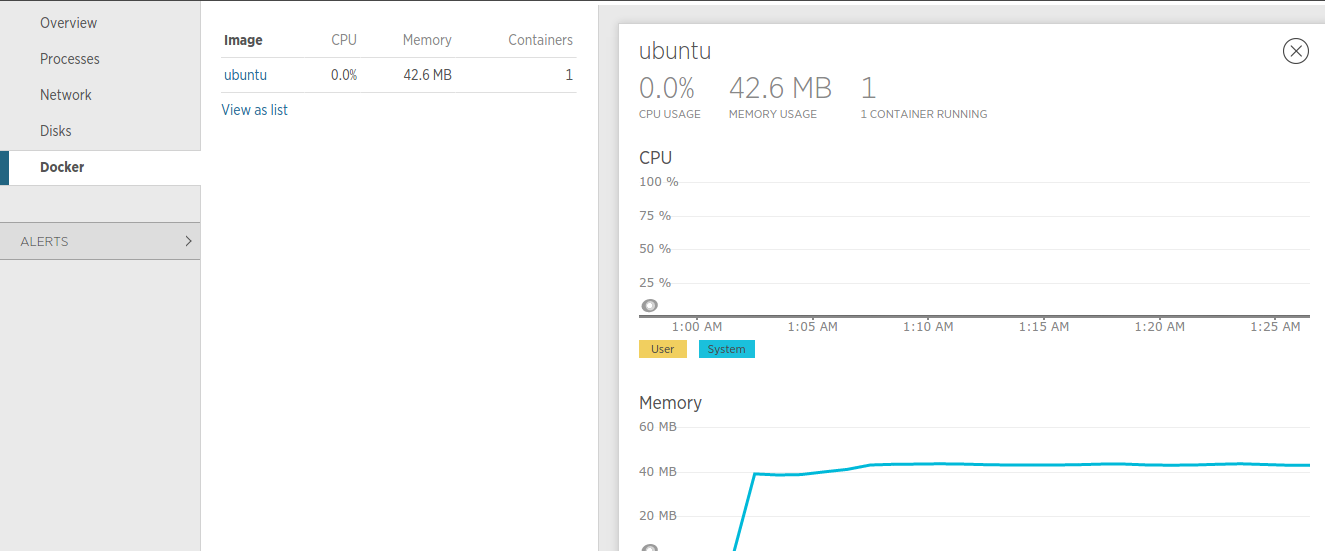
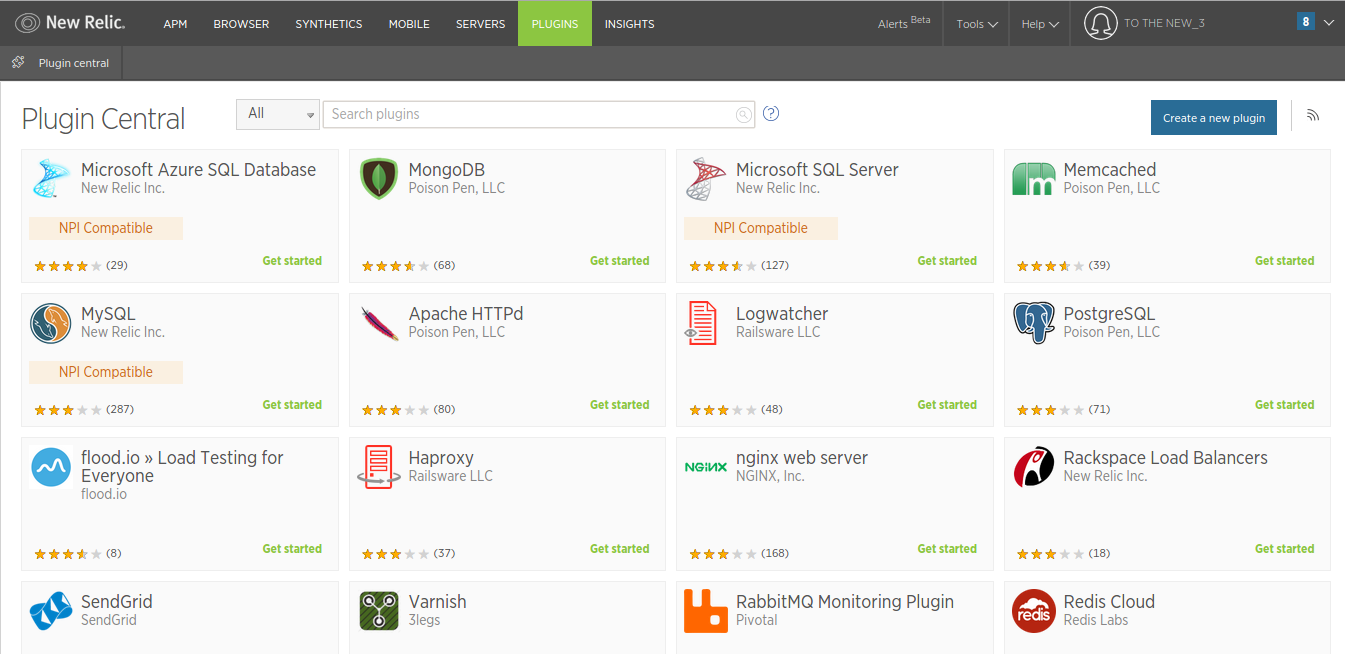
The above is again very simple to understand. That is all this Docker option here gives us. The information they provide on the containers is simply the cpu and memory. It is trivial to determine exactly what the container might be doing, like any regular server, it could be running anything. For example: If an image runs an application, you may want to run one of their APM agents for better insight. So, you could simply head on to plugins:
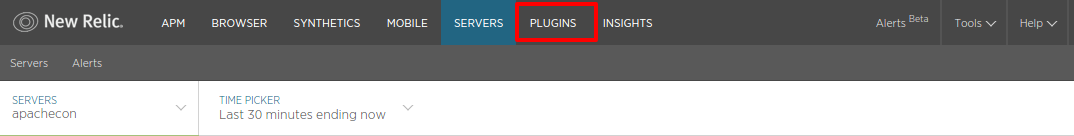
It has almost every plugin available for you. You can use the search bar to search what you are looking for depending on what is running inside you container. You will need to install New Relic agent inside the container like we did on the host machine earlier and then integrate a plugin with it to see insights in the APM menu where data will be segregated according to server then container ID.
You can select any plugin:
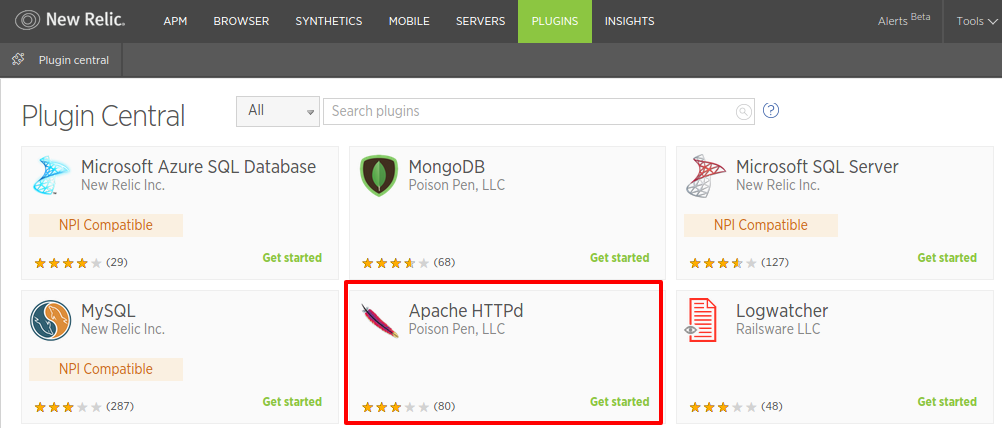
It will show you all the steps on how to go about it:
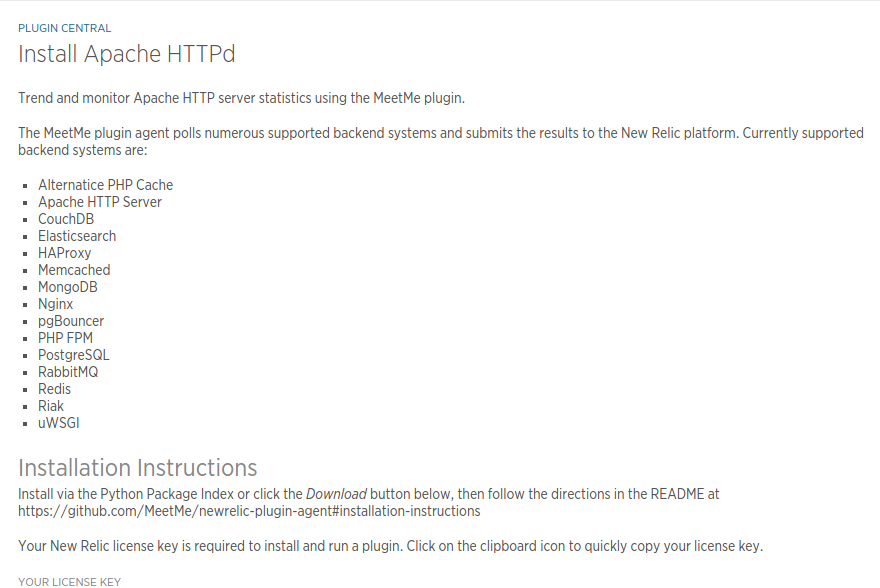
So, New Relic can help you monitor your Docker container and give you insights in depth. A lot of features are yet to be integrated with New Relic specific to Docker. That should be happening anytime soon.


Concise and to the point. Thanks!