ELB Log Monitoring With Sumo Logic
In AWS, we can enable ELB logs and save them on S3 bucket. Analysing the ELB logs provide end-to-end visibility of all requests, but it’s a quiet big challenge to get a granular detail of each request. Sumo Logic collect logs from various resources and we can analyse these logs with respect to various parameters. It uses log reduce technologies and does log processing to convert collected data into triable insights to deliver reports, search and extract fields from collected data set. So here we are going to configure Sumo Logic to monitor traffic trend between ELB and backend hosts. The best thing which I liked there is no need to install any agent on your running hosts. We can monitor all logs after login into Sumo Logic account. Let’s get our hands dirty with configuration.
Configuration Steps:-
1. Enable ELB Logs
2. Create an IAM User
3. Configure Sumo Logic
1. Enable ELB Logs:-
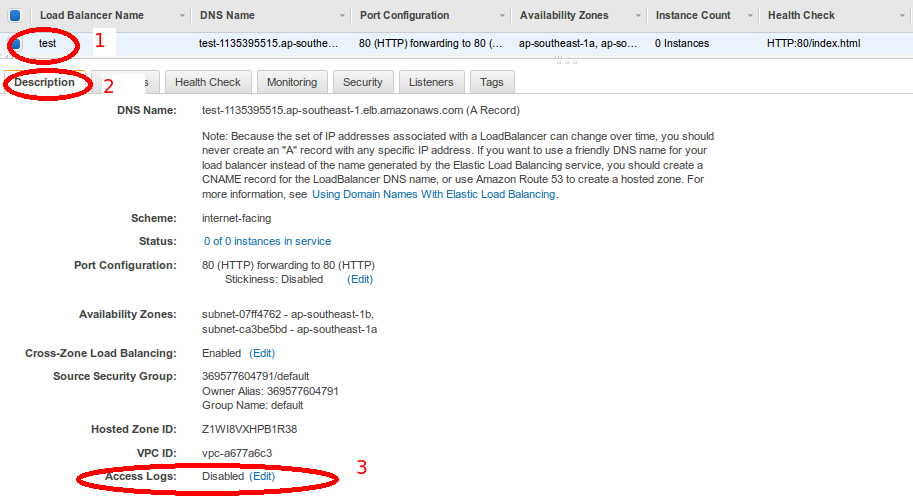
First of all, we have to enable logging on ELB. If logs are already enabled on your ELB you can skip this step and move to the second one. To enable this navigate to EC2 –> Load Balancers –> ELB_Name –> Description –> Access Logs and click on edit.
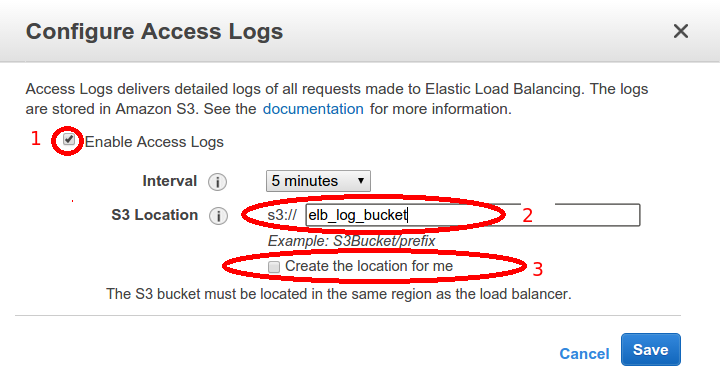
In a pop-up window, Click on the checkbox next to “Enable Access” log and then type your bucket name. Before moving to next step don’t forget to check the log file in the bucket. It will take max 5 min to replicate changes.
2. Create an IAM User:-
We need an IAM user with a secret and an access key to configure this within sumo logic and with the help of this user it will pull all ELB logs from the S3 bucket. I have created a user named “sumologic_s3” and assigned below policy to grant read access on bucket named “elb_log_bucket”.
[js]
{
"Version": "2012-10-17",
"Statement": [
{
"Action": [
"s3:GetObject",
"s3:GetObjectVersion",
"s3:ListBucket",
"s3:ListBucketVersions"
],
"Effect": "Allow",
"Resource": [
"arn:aws:s3:::elb_log_bucket/*",
"arn:aws:s3:::elb_log_bucket"
]
}
]
}
[/js]
3. Configure Sumo Logic:-
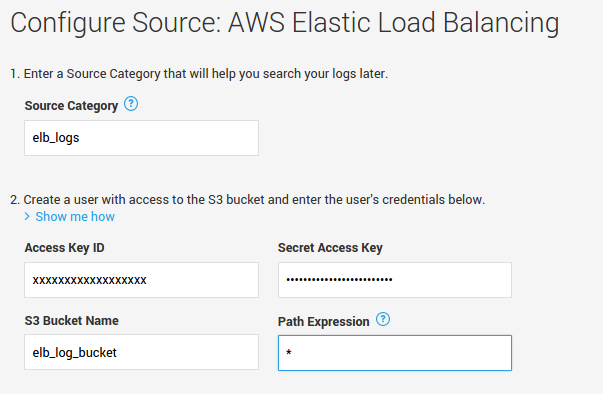
Now login to your sumo logic account and to configure it navigate to Manage –> Setup Wizard. It will ask you to select application type which you want to configure. So select ELB and fill all the fields with required values which we created in the previous section. You can use any name in “Source Category” and make sure in “Path Expression” must insert an asterisk (*). Once you are done with this, click on finish and it will take some time to fetch all your ELB logs and to generate default log stats.
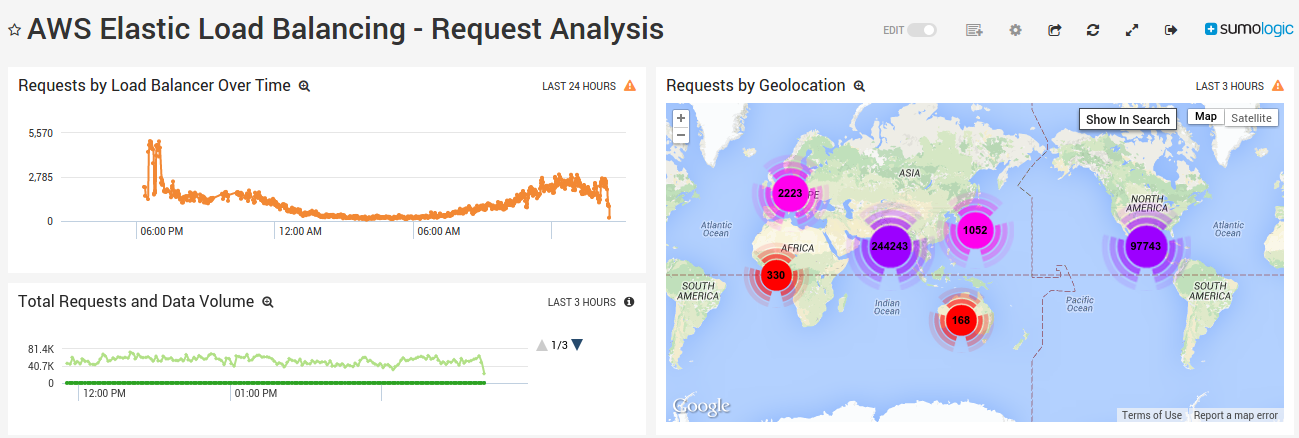
To check log statistics goes to Library –> Personal –> AWS Elastic Load Balancing. As you seen below we have five default dashboards with different analysing criteria. It helps us to optimize and scale application performance based on different availability zones and to deliver rich end user experiences.
1. Latency/Status Codes by client’s IP
2. Latency/Status Codes by application URL
3. Latency/Status Codes by Backend hosts
4. Requests by Geolocation
5. Total number of requests per min
Sumo logic also provides wide support for AWS monitoring and analysing CloudFront, S3, CloudTrail and Apache logs. We can create our custom log search and alerts to react in real time and centralize monitoring provide us insight view to perform root cause analysis.