The power of YouTube Analytics
YouTube, the most widespread and popular video site on the web today is humongous in many aspects.
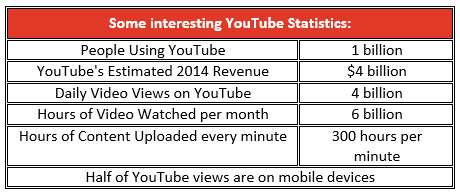
YouTube’s growth is still fast-tracking despite taut competition from Facebook and others. Since its launch in November- 2009, YouTube has been home to everything from shaky home movies to fully produced videos. As well as being the most well-known video site in the world, YouTube is also the 2nd biggest search engine after Google, its parent company.
For content creators and YouTube partners, it is of paramount importance to understand the data behind their videos and that is where almighty YouTube analytics comes in the picture.
Understanding YouTube Analytics and its features:
- Getting to YouTube Analytics: Creators and channel managers can use YouTube Analytics to study a single video, a definite group of videos or all the videos in your channel.
How one accesses, analytics depends upon which data facts you’re seeking.
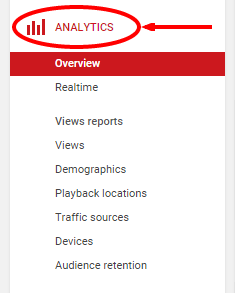
To access channel and video analytics for a YouTube channel, you need to login to your channel, open “Creator Studio “and click “Analytics” on the left. Or, you can go to https://www.youtube.com/analytics and reach the same view. Once selected, YouTube Analytics provides access to a number of different data views.
2. Grouping Videos in YouTube Analytics: One handy analytics feature is the ability to create groups of chosen videos to analyze or to compare one group to another. Similarly, groups of various video playlists could also be created.
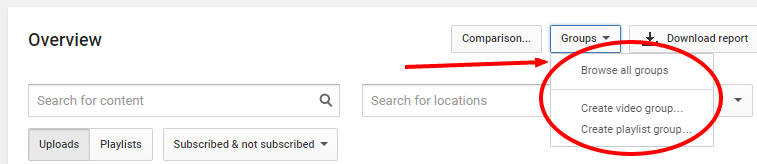
To create a group, click the “Groups” drop down menu and choose “Create Video Group”.
That opens a Create Video Group screen that lets you search and select the videos for the group. You can then choose the “Comparison” button to open two videos or two groups and perform comparative analysis.
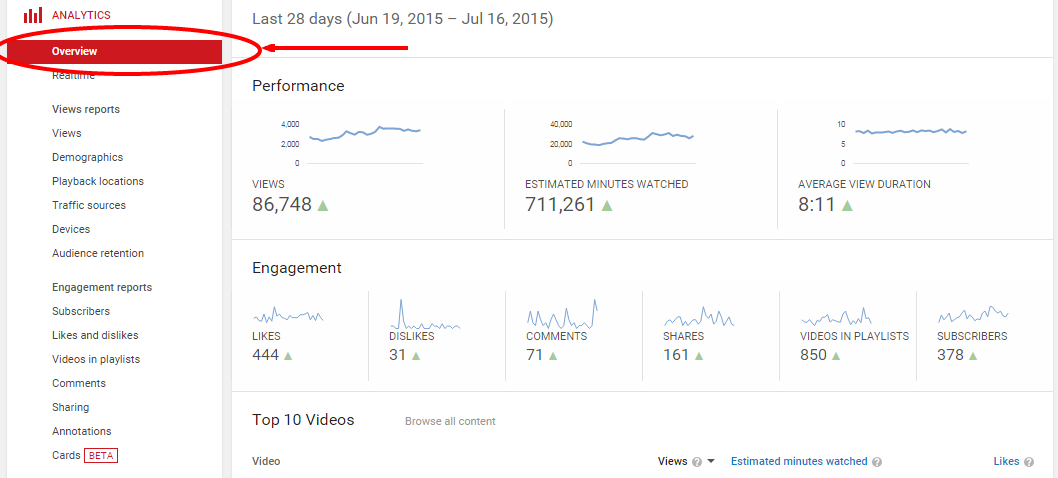
Upon entering YouTube Analytics, you’ll notice a group of options in the column on the left side of the page.
3. Overview: Overview analytics page showcases a dashboard with an overview of channel’s performance, as well as the top 10 videos for a particular time period. You can filter data based on a specified time period as well as geographic location.
4. Realtime: Realtime analytics dashboard provides video publishers a minute-by-minute look at how many people are watching their videos. The real-time section shows estimated real-time viewership data for channel’s last 5 published videos in two sections, minute-by-minute for the last 60 minutes and hour-by-hour for a sliding window of the last 48 hours.
5. Views Reports:
- Views: This uncomplicated report provides some very complex data. Channel manager can use this report to see the total views for a channel during a particular time period, video watch time for that time period, top viewed videos, and video specific views, estimated minutes watched and average view duration. Clicking on a video title allows you to see the geographic locations where that video was viewed, as well as how many times and for how long the video was seen from that location.
- Demographics: No surprises here, this report does exactly what it sounds like it would. It lets you see the demographic information for your viewership, so you can compare and see how well it aligns with your actual target audience.
- Playback Locations: This particular report shows where people are watching your videos the most. It shows if they are watching videos directly on YouTube or mobile devices or embedded players. It also tells which off-site locations are generating the most views. This will tell you if people are taking your videos on the go or using them on their websites and sharing them on their social profiles.
- Traffic Sources: The Traffic sources report is exceptionally valuable. It tells you how people discover your channel – for example if views are coming from YT advertising or YT Search, or perhaps they found it through some other search site. The report also shows views and watch time obtained from those platforms.
What is so amazing and beneficial about this report is that we can fetch search-related traffic sources to get a report of the keywords used to find your channel. This data helps a channel manager to curate optimization strategy accordingly. You can see if channel’s paid campaigns are working as they are supposed to. You could also analyse if channel optimization strategy is operating to drive video search in YouTube and all other search engines. You can also see if the keyword/tag that you’re trying to target is doing the trick for you, or if any adjustments need to be made.
Audience Retention: Below is an example, with channel name concealed for confidentiality: Audience retention report just might be the handiest report in analytics. You can see channel’s average view duration, as well as the viewing duration of your top videos.
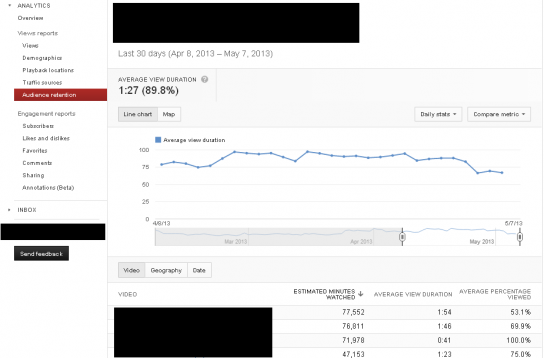
In the above-shown screengrab, for the top video, the average visitor is only viewing just over half of the video. Based on this analysis, channel manager needs to tweak something to increase engagement – an annotation halfway through that says “Lookout for ABC at the end of the video”. Or maybe driving a visitor to another video or playlist within the channel or maybe the viewer is not interested in seeing rest of the video or misleading metadata could also be one reason. There are a variety of actionable steps that could be taken on each video based on the video’s individual analytics.
6. Engagement Reports: Engagement reports show who your audience is, where you’re attracting them as well as where exactly you’re losing their attention.
- Subscribers: This report tells you where your subscribers are coming from. It can tell you which of your videos are getting the most subscribers, how is the channel loosing and gaining subscribers.
- Likes and Dislikes: This reports tells the number of likes & dislikes on YouTube channel, as well as for specific videos. It also shows video’s total engagement in regards to likes, dislikes, shares, adds to favorites and other engagement metrics.
- Videos in Playlists: Playlist analytics feature was introduced by YouTube in April 2014. Video playlists are vital for any YouTube channel strategy. In Playlist analytics, you will be able to see directly how a playlist is performing on the channel. This report shows the total number of views from channel’s playlists, how many times the viewer watched a playlist, the average time they watched, and other related playlist related data.
- Comments: The comments report shows you everything about the comments section in all your videos. Channel Manager can also see the section of words that are most widely used in user comments on videos. This report also shows which geographic location is producing more comments.
- Sharing: The sharing report shows which videos are shared the most commonly. This report also tells that on what social platform (Facebook, Reddit, Whats App, Google+, Tumblr, Blogger or Twitter etc.) the video is shared and the user engagement on those particular videos.
- Annotations: Annotations, YouTube’s clickable pop-ups, may not be a popular feature for the viewers. Though, for a creator, annotations are beneficial if used correctly. Annotations report will show annotation’s performance. It indicates the number of clicks an annotation is getting, annotation’s close rate by the viewer. From there, the channel manager could analyse the click-through rate of an annotation, or evaluate whether its placement is invasive and making viewers close it.
- Cards: Cards are like an evolution of annotations. They notify viewers about other videos, merch, playlists, websites and are mobile friendly. This report is still in BETA mode keeping in consideration that it’s’ a new feature. The report shows card teaser clicks, card clicks, and their click rate.
Key Takeaways from YouTube Analytics:
There are numerous key takeaways for a creator and channel manager from YouTube Analytics:
1. To take informed channel strategy decisions rather than following the gut.
2. To evaluate channel’s performance and examine changes or inclinations across key metrics.
3. To gain actionable understandings for creators to make better videos, implement and measure optimizations.
4. To assess channel’s performance and make changes to the content and its facets and audience strategies based on the findings.
5. To reveal real viewer data and the content they engage with the most.
6. To measure viewer engagement.
YouTube Analytics will most certainly help creators and channel managers to get the most out of their YouTube channel. Mining, analysing and fetching analytics data is exciting and informative at the same time. It shows channel manager how hard work is paying off. Understanding analytics data and then adapting your channel optimisation strategy would without doubt majorly influence channel’s reach, video watch time, views, number of subscribers, viewer engagement and most importantly channel’s earnings.