If you’ve worked with Adobe Analytics, you’ve probably done this more times than you’d like to admit:
Open DevTools → Network → filter b/ss → click → scroll.
Everything is technically there, but reading it isn’t exactly smooth. It’s one long URL, parameters packed together, values encoded, and no real structure to guide your eyes.
Debugger extensions help, and they do a good job of organizing things. But even then, I’ve noticed situations where they can be slightly confusing. Sometimes it looks like multiple calls are firing, when in reality it’s just one request being interpreted differently.
Because of that, I usually fall back to one thing: The actual b/ss network call. That’s the closest thing to the source of truth.
A Simple Idea
What if instead of trying to inspect that raw URL every time, you could just:
Copy the request URL, paste it somewhere, and see everything in a clean, structured format?
- No scrolling through a long string.
- No decoding values mentally.
Just something that is:
- readable
- consistent
- easy to scan
That’s what we’re going to build using Postman.
Quick Note on Postman
If you haven’t used Postman before, it’s basically a tool used to send and test API requests. In simple language, Postman is a simple tool that lets you “talk” to apps and websites behind the scenes to see how they work.
It helps you send requests and instantly view responses, making it easier to understand and test digital services without needing deep technical skills.
We’re just using it to process the request itself.
What We’re Building
We’ll create a simple setup inside Postman that:
- takes an Adobe Analytics beacon (b/ss URL)
- parses all parameters
- formats them into a clean structure
- highlights a few things that might be worth a look
After setting it up once, the workflow is simple: copy → paste → run → review.
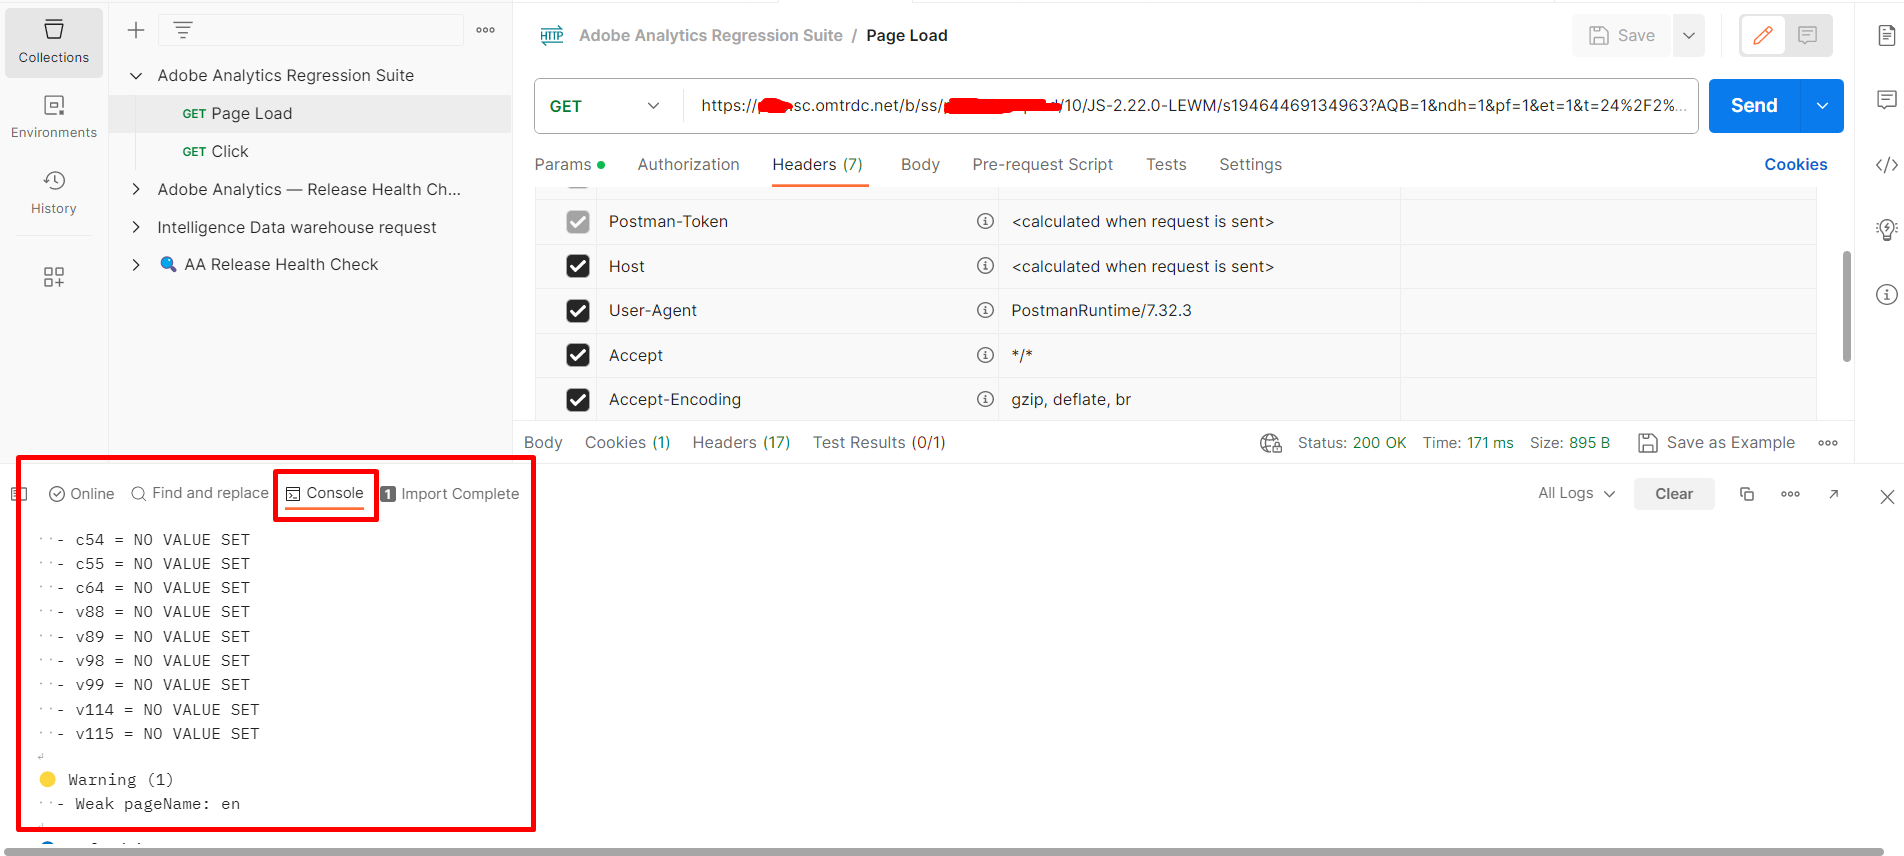
What the Output Looks Like
Instead of reading a long query string, you’ll see something like:
pageName   : homepage

events     : event1,event2

v1         : logged in

c54        : NO VALUE SET
Everything is aligned.
Everything is in one place.
You can quickly scan the output.” or “Your eyes can quickly scan the data.
Not a Validator — Just a Better Way to Read
This is important to understand.
This setup isn’t meant to decide whether something is right or wrong.
The reason is that if any eVar or prop shows as “unspecified” or has no value set, it will still be highlighted. However, that doesn’t automatically mean there’s an issue. In some cases, those variables are not supposed to capture any value for that particular page load or user action.
So, while the setup helps you quickly spot these cases, you’ll still need to check and decide whether it’s actually a problem or expected behavior.
It simply helps you notice things like:
- empty values
- placeholder values
- generic names
- unusual patterns
For example:
- NO VALUE SET might be completely expected
- An empty eVar might be intentional
But when everything is laid out clearly, it’s easier to spot what you want to look into.
Post UI
It becomes useful in situations like these:
- Checking multiple pages
Homepage, product page, checkout…
You’re looking at similar beacons again and again.
Having the same structured format every time makes it easier to stay consistent.
- During release cycles
Let’s say your team pushes updates every month.
Now you want to quickly check:
- Did anything change?
- Is something missing?
- Does anything look different?
Instead of manually scanning everything again, you can:
- Take a beacon before release
- Take a beacon after release
- Run both through the same setup
It gives you a quick, high-level sanity check.
Sometimes nothing is clearly broken, but something doesn’t look right. This helps you see those small differences more easily.
How to Set It Up (One-Time Setup)
Step 1: Create a Collection
- Open Postman.
- Click New → Collection.
- Name it something like Adobe Analytics Beacon Parser.
Postman UI and collection code details
Step 2: Add the Script
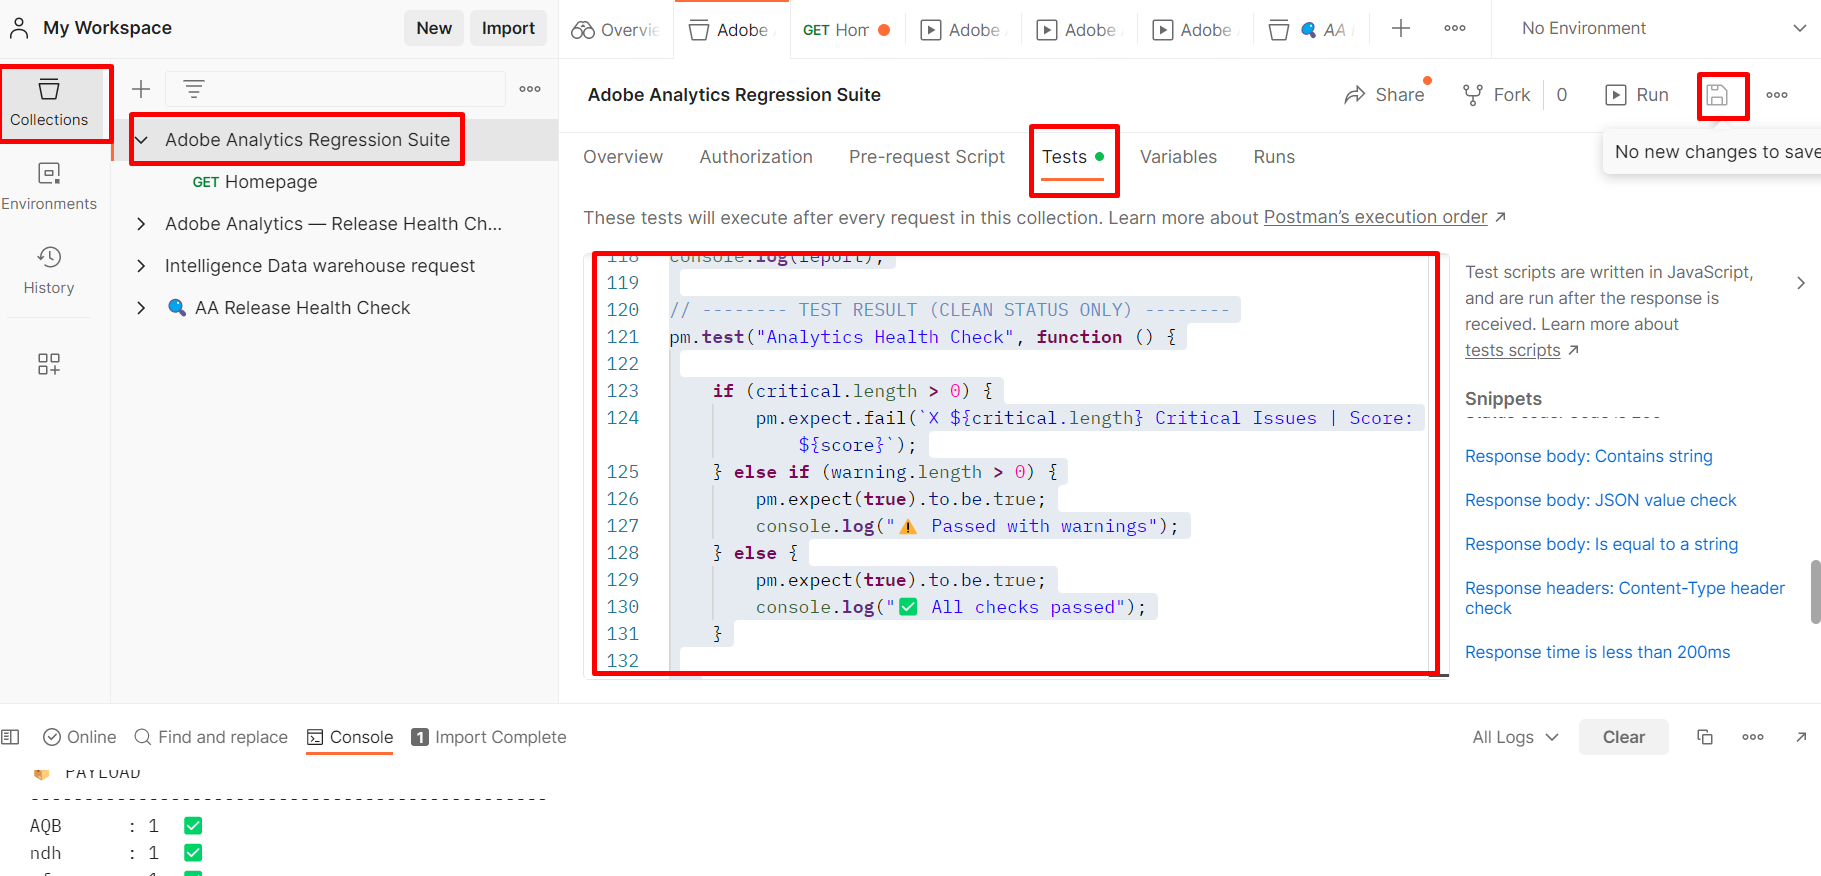
Open the collection → go to the Tests tab → paste this:
let url = pm.request.url.toString();
// ——– PARSE ——–
let query = {};
if (url.includes(“?”)) {
url.split(‘?’)[1].split(‘&’).forEach(param => {
let [key, value] = param.split(‘=’);
try {
query[key] = decodeURIComponent(value || ”);
} catch (e) {
query[key] = value || ”;
}
});
}
// ——– STORAGE ——–
let critical = [];
let warning = [];
let info = [];
function addCritical(msg) {
critical.push(msg);
}
function addWarning(msg) {
warning.push(msg);
}
function addInfo(msg) {
info.push(msg);
}
// ——– RULES ——–
let badValues = [
“”,
“undefined”,
“null”,
“unspecified”,
“no value set”
];
let detailed = [];
let maxKeyLength = Math.max(
…Object.keys(query).map(k => k.length)
);
// Visitor ID
if (!query[“mid”]) {
addCritical(“mid (Visitor ID) is missing”);
}
// Loop variables
for (let key in query) {
let val = query[key];
let lower = (val || “”).toLowerCase();
let label = “✅”;
if (badValues.includes(lower)) {
label = “🔴”;
addCritical(`${key} = ${val}`);
}
else if (key.startsWith(“v”) && lower.includes(“no value”)) {
label = “🟡”;
addWarning(`${key} = ${val}`);
}
else if (key.startsWith(“c”) && lower.includes(“no value”)) {
label = “🟡”;
addWarning(`${key} = ${val}`);
}
else if (
key === “pageName” &&
[“home”, “homepage”, “en”, “index”].includes(lower)
) {
label = “🟡”;
addWarning(`Weak pageName: ${val}`);
}
// Events check
if (key === “events”) {
let matches = val.match(/event\d+=(\d+(\.\d+)?)/g) || [];
matches.forEach(e => {
if (e.includes(“=0”)) {
addCritical(`Zero event: ${e}`);
label = “🔴”;
}
});
}
let paddedKey = key.padEnd(maxKeyLength, ” “);
detailed.push({
line: `${paddedKey} : ${val}`,
label
});
}
// ——– SCORE ——–
let score = 100;
score -= critical.length * 10;
score -= warning.length * 5;
score -= info.length * 2;
if (score < 0) {
score = 0;
}
// ——– BUILD DASHBOARD ——–
let report = “”;
report += “\n📊 ANALYTICS HEALTH DASHBOARD\n”;
report += “================================================\n\n”;
// PAYLOAD
report += “📦 PAYLOAD\n”;
report += “————————————————\n”;
detailed.forEach(item => {
report += `${item.line} ${item.label}\n`;
});
// SUMMARY
report += “\n🚨 ISSUES SUMMARY\n”;
report += “————————————————\n”;
report += `🔴 Critical (${critical.length})\n`;
critical.length
? critical.forEach(i => report += ` – ${i}\n`)
: report += ” None\n”;
report += `\n🟡 Warning (${warning.length})\n`;
warning.length
? warning.forEach(i => report += ` – ${i}\n`)
: report += ” None\n”;
report += `\n🔵 Info (${info.length})\n`;
info.length
? info.forEach(i => report += ` – ${i}\n`)
: report += ” None\n”;
// SCORE
report += “\n📊 FINAL SCORE\n”;
report += “————————————————\n”;
report += `Score: ${score}/100\n`;
report += “================================================\n”;
// ——– PRINT TO CONSOLE (ALWAYS) ——–
console.log(report);
// ——– TEST RESULT (CLEAN STATUS ONLY) ——–
pm.test(“Analytics Health Check”, function () {
if (critical.length > 0) {
pm.expect.fail(
`❌ ${critical.length} Critical Issues | Score: ${score}`
);
} else if (warning.length > 0) {
pm.expect(true).to.be.true;
console.log(“⚠️ Passed with warnings”);
} else {
pm.expect(true).to.be.true;
console.log(“✅ All checks passed”);
}
});
Set the method to GET.
- Paste your b/ss URL (which should look like – https://abc.sc.omtrdc.net/b/ss/rsid/10/JS-2.22.0-LEWM/s19464469134963?AQB=1&ndh=1&pf=1&et=1&t=2……..)
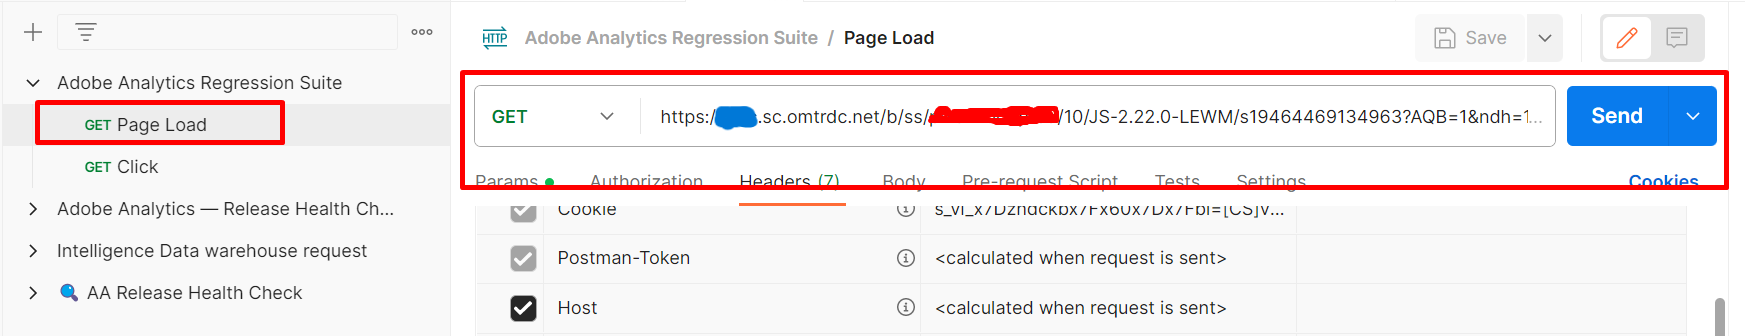
b/ss network call URL
Step 4: Run It
- Click Send
- Open Postman Console
You’ll see the parsed output.
Final Thought
This is not a replacement for debugging tools; it just makes one part easier: reading the beacon.
Essentially, we are taking the most reliable debugging method—the raw beacon—and making it readable for quick analysis. This is especially useful when you’re doing a high-level sanity check. For example, going through key pages like the homepage, product page, or checkout, and validating important interactions as form submits, search, or purchase events.
And that’s where this can become useful, just simply copy and paste the request URL, keep on adding new requests under one collection, and review the output in a consistent format. Another small advantage is that everything stays saved. So if you want to revisit a specific check later, you don’t have to capture it again — it’s already there.