In the era of digital transformation, organizations are adopting a mobile-first strategy, and this has led Mobile App at the center point in their business plan. Eventually, App-Marketing is becoming more relevant in the present age across the industry. Hence, monitoring the performance of an app becomes the priority of the marketers.
Since you have spent the time and money building your app, hence it becomes more imperative to assess how it’s doing. There are a lot of tools available in the market which can track the below-discussed metrics. Some of these metrics are available by default in the tool itself and does not require any custom implementation, whereas some metrics which are unique to a particular industry may require some custom implementation.
Below is the list of metrics applicable for all kinds of apps that must be taken into account while analyzing the performance of an app. The different metrics needed to track app performance can be grouped into the following categories:
- User Acquisition
- User Interaction
- User Retention and Churn rate
- App Stability
- App Performance
- Ratings and Reviews
The performance of above-listed categories are inter-related. Let us deep dive into the metrics for better understanding:
- User Acquisition:
(a) Number of Installs: This is the most basic metric any app marketer need to gauge their user base. Different tools have different ways of measuring this parameter. For example, Firebase measure installs through First_open event, and that event is fired when the user launches an app for the first time after installing/reinstalling it. One should keep a note that this event is not triggered, when a user downloads the app onto a device, but instead when he or she first opens it.
Similarly, mix panel capture app installs through their event named as First App Open. For the number of installs on the Android app, we can gather the details from Google Play Console however, the number of installs on iOS can be gauged from App Store Analytics.
This event does not need any custom implementation and is readily available once you implement the SDK (Software Development Kit) in your app.
(b) Number of Uninstalls: This metric will give you information on how many users have uninstalled your app. We can get this detail just by implementing SDK in android. However, we can not track the same in the iOS device.
Google play console gives you uninstalls for android app while other tools have default events which specify the number of apps uninstalls.
(C) App Attribution: It allows you to track the sources that lead users to your app. ie from where your users are coming. This metric is especially useful in measuring the success of marketing campaigns based on which marketing effort led to your user download, signup, sale, etc.
There are a lot of tools available in the market which gives details about the attribution data and success of marketing campaigns. This is generally tracked through app deep linking.
- User Interaction:
(a) Daily Active users, Weekly active users, and Monthly active users: This parameter will give information about how many users are active on your app on daily, weekly and monthly basis, which is a reflection of the stickiness of your app. Higher the stickiness, lesser the chance of user uninstalling the app from their device.
This metric is available by default on any tool and does not require any custom implementation.
(b) User Engagement: This metrics measure the value of engaging users. Some of the common metrics include the average time spent on the app, the average time spent on each screen, screen views per visit. These metrics again depend upon the business objective and goals.
(C) App Abandonment: It is the rate of users who abandon your app specifically before signing up. High abandonment rate points to inadequacy in the app engagement process or another issue which is discouraging the new users from signing up.
3. User Retention and Churn Rate
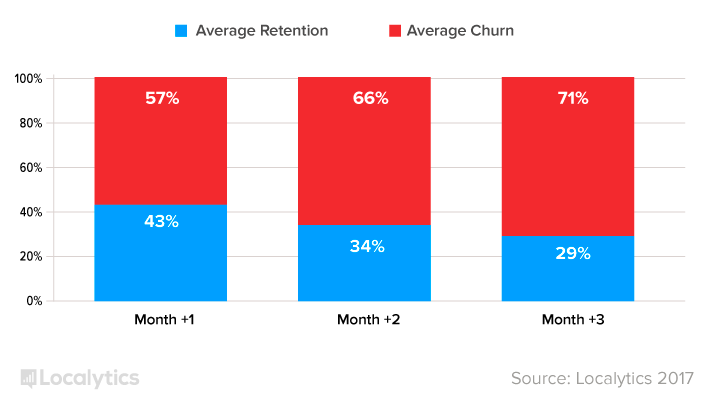
(a) Retention Rate: One of the most prominent challenge app marketers face is the retention of the app on the user’s device. As per localytics, 57% of the app gets removed from the user device within 30 days of install.
(B) Churn Rate: This metric is the companion of retention. It is a measure of the percentage of users who uninstall your app from their device. To address a high churn rate, take a closer look at who is leaving your app and act accordingly. For lowering down the churn rate in the initial days of app installation, there should be an effective and delightful user engagement process. Similarly, there are other metrics like app crashes and app start trace, which also influence the churn rate.
- App Stability
App Crashes: Every marketer will like to provide a hassle-free experience to their app users. The higher instance of app crashes will increase the number of uninstallations from the user. Hence, it is critical for marketers to monitor the app crashes and take corrective actions.
- App Performance:
(a) App Start trace: It measures the time between when the user opens the app and when the app is responsive. As a thumb rule, it should be below 1-2 seconds.
(b) App latency: It is a measure of the delay between any app action and its response. This is a critical metric to ensure that user experience doesn’t suffer.
Both these metrics are available upon integrating performance SDK on your app.
- App Ratings and Reviews:
Your app ratings and reviews reflect what the user thinks of your app. Your app ratings and reviews can make or break your app, as it influences the user downloading the same.
Apart from the metrics mentioned above, there are various metrics which might be significant to the marketers depending upon your business goals and objectives. If the app is an ecommerce one, then definitely conversion metrics like Purchase, Average order value, Revenue, etc. will be of high importance whereas if the app is non-ecommerce, then user engagement is of great importance.
Here, we have touched upon those generic metrics which are applicable to all categories of the app regardless of their business objectives. The digital analytics team at TO THE NEW will minutely assess your mobile app, and based on your business will clearly define what KPIs will work best for you. On the basis of those selected ones, we will carve out the digital strategy to make sure it aligns with your overall organizational goals.
Detailed yet precise info. Thanks for sharing.
Quite an informative blog.
Nice and informative blog. Thanks for sharing with Newer..