Actionable analytics to Drive Video engagement and Ad monetization
Many more content owners, Pay TV operators and broadcasters are rolling out their own OTT video platforms and mobile apps these days, aside to the fact that most of these content businesses push their content on YouTube to maximise their reach and revenue through video advertisements.
Needless to say that OTT video is bringing a phenomenal shift in television industry and we see a lot more innovation in this space, starting from video production, storage, processing to video distribution. Amidst all this, consumers change their viewing patterns and leave a measurable graph for the same on either platforms used by them to view the content they like and follow.
It becomes all but more critical for video businesses to track and measure the user journey and engagement with their content across devices, platforms and demographics. The key lies not only to understand their consumer, but to derive actionable analytics that helps them create and change their content strategy to adapt a more data driven and informed content generation for increasing viewership, engagement and eventually generating revenues. In this short piece, we will share some of our learning from developing and driving video products and try to suggest some key actionable parameters and approach towards data-driven content strategy.
Lets take a holistic approach towards capturing video analytics and derive at multiple classifications of parameters that are measurable-
- Audience behaviour
- Audience engagement
- Content performance
- Quality of service- Utilisation analytics (Data storage, bandwidth, quality, etc.)
The above can clearly be segregated for different content flavours- Time-shift TV, Video on demand and Live content, and will have different insights for each flavour. Content owners can derive at many logical conclusions only at aggregating reports from all the above-mentioned categories.
Below, we will dissect each category and identify critical parameters that really matter the most and can quickly help content owners derive insights and apply to their content and user acquisition/engagement strategy-
- Audience Behaviour- Few of the key metrics a business should consider while measuring audience behaviour-
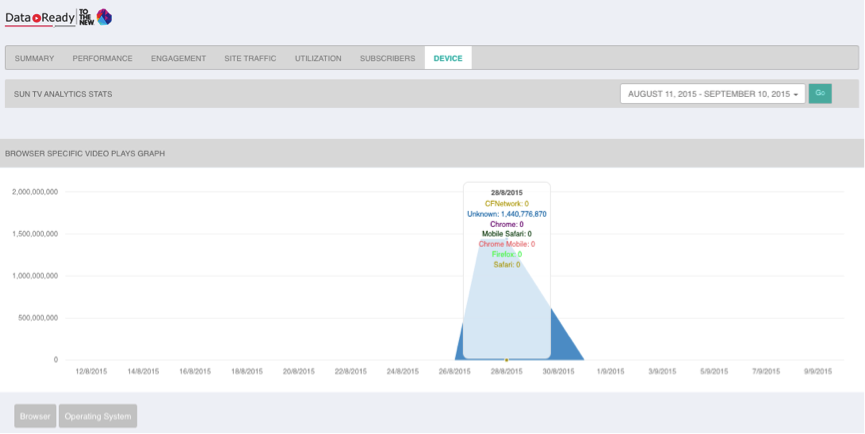
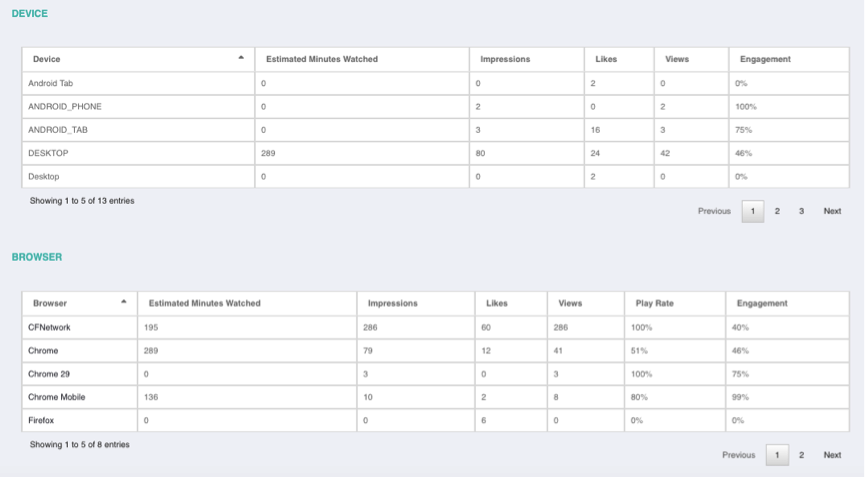
- Device analysis stands as the most basic data to be captured, it gives you a clear overview of where/which platform your video is being consumed, mobile, tablet, desktop or smart TVs.
- Platform/OS can help you deep dive into video consumption across various device types, platforms (iOS, Android, web) and help you tweak your delivery mechanism to better the experience on low performing devices, test for any anomalies.
- Browser/OS versions will tell you where to focus; is it worth putting efforts on certain browsers, app versions, OS versions, etc.? A common example is trying to stream video on Android version 4.0 and below. It’s a pain and comes at a high cost.
- Engagement rate
- Completion percentage
- Play duration per visit
- Plat duration per viewer
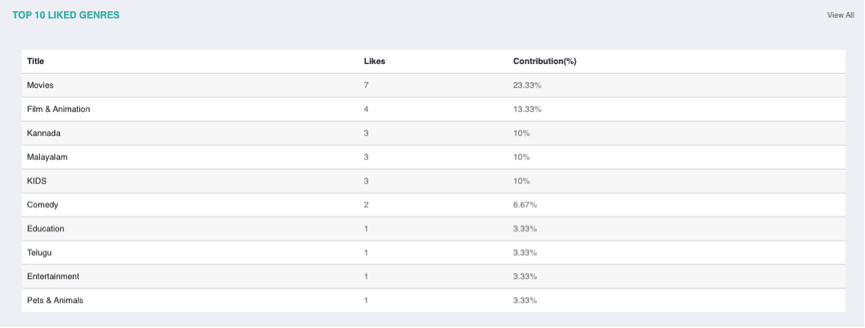
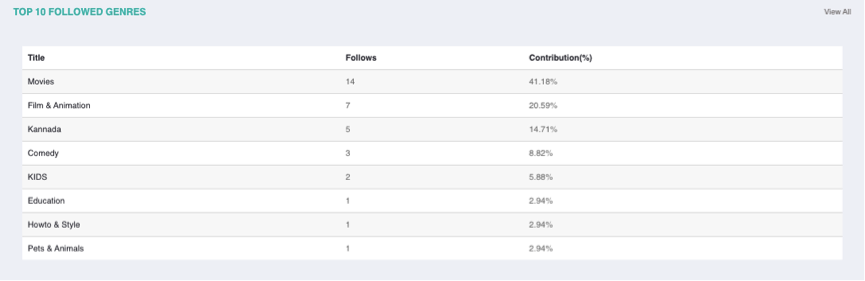
- Content Trends- Trend analysis is not raw data; but insights based on permutations of the above parameters, which helps you understand the performance of your content deeply into each channel, type, genre, etc. Based on these trends like “Highest Grossing”, “Usage per hour of day”, “Top Genres”, “Top Types viewed”, etc., a content owner can predict Usage behaviour and change his content strategy to maximise the output, reach and ad revenues.
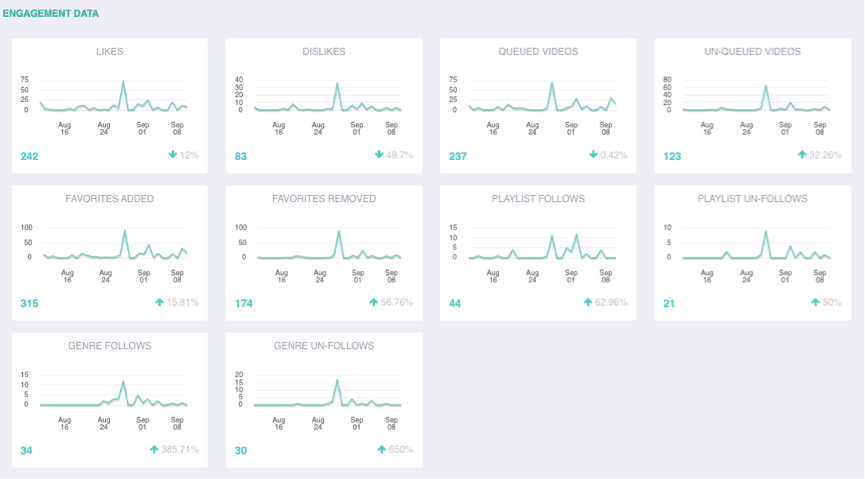
- Audience Engagement- is a must to have data point and your APP/Platform must have enough intuitive features to capture user actions and engage user. For e.g. like, shares, records, views, etc. are some parameters that help you understand user behavior, their interest in your content. A user is more likely to share a video if he watched it more than 50% of duration and liked it. One needs to know exactly what action user is taking to engage with the video content, to map his preferences, likes and dislikes. Some such attributes to be considered are-
- User Likes
- User Comments
- Share
- Followed
- Favorites
- Queued
- Logins/Register
- Social Sign ups, etc.
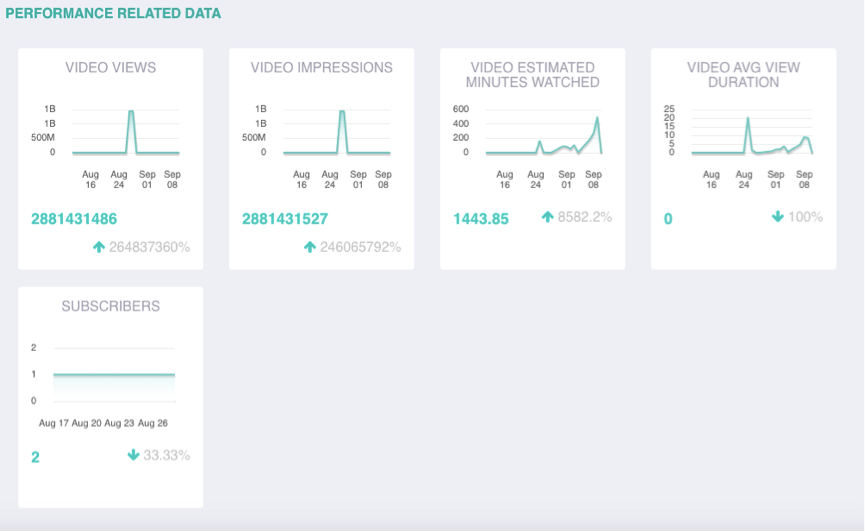
- Content performance- Content is very expensive and the ultimate goal of any content business is to drive more traffic and increase viewership to all the published videos. Live content will have more real time data, which impacts the user behaviour and app’s performance in case of a live event, while Video-on-Demand data will be persistent and have significant impact on understanding user behaviour over a period of time, their preferences, demographics, etc. Some of the key data points worth capturing and analysis are as below-
- Play starts
- Video impressions
- Total viewers
- Unique viewers
- Drop off rate
- Average Watch time/Play duration
- Viewers growth/drop per minute
- Device wise distribution
- Average bandwidth
- Peek viewers
- Plays per viewer, etc.
- Audience location
- Demographics
- Connection type
- Bandwidth versus Connection
- Ad starts
- Ad skips, etc.
- Utilisation analytics- Analysing content utilisation and managing costs by archiving, compressing content that has achieved its shelf life comes as a very important decision for content owners looking for better ROI. Delivering content is a very expensive business where you pay for content storage, transcoding, CDN delivery, edge storage, etc.
Some such critical parameters for measuring content delivery and utilisation are
- Connection type
- Format played
- Max. bitrate played
- Average bitrate played
- Network Type
- Monthly storage
- Transcoding storage
- Transcoded minutes
Above are some snapshots from the kind of Analytics embedded into our end-to-end video delivery OTT platform “VideoReady”, which not only gives its users data points, but also deep level filtering to understand the consumption behaviour of each user, demographics, etc. We at VideoReady treat Analytics as a separate scalable module and hence also brand it as “DataReady”, which is loosely integrated with application to give maximum scale but drives the core of user personalisation and recommendation engine using big data technologies like Hadoop and Flume.
Some key benefits/features of VideoReady are specified below-
- Analytics is measured in a separate application/module so as to isolate client app’s working and eliminate dependency whilst allowing extremely high scalability
- “DataReady”, which is our Analytics module, not only provides content owners access to more than 100 data points, but clearly uses data algorithms for multiple permutations/combinations for these data points to come with logical content insights- like key video trends, user’s time of video viewership, top grossing shows/channels, etc.
- VideoReady’s analytics provides a huge data repository for recommendation engine that drives personalization and helps gain more viewership and engagement.
- Above all, VideoReady uses this analytics to drive App marketing by automated push notifications to users, for e.g. –
- A particular user, who is following “House of Cards” and regularly watches the videos at 4:00 pm daily, will be automatically sent a push notification at a configured time like 3:00 pm to access the show
- A set of users who follow a particular show/genre, will be notified automatically with rich media notifications on his mobile devices or via e-mail, whenever a new episode is added to the show/genre