
Building a Central Log Server with Logstash
If you are an operations guy and your development team has built some very cool application which is hosted on several web servers; the main concern is to find out the bugs and closely monitor the Application Error logs from different servers.
Things that you can do in this case are:
- Give server access to development team to view the application (Seriously you won’t do that )
- Use some utilities like rsyslog or syslogNg ( Too much to configure and gets very complex at times )
- Use paid applications like loogly
Or you can use Logstash.
What is logstash?
logstash is a free and open source tool for managing events and logs. You can use it to collect logs, parse them and store them in a central place. logstash is now also a part of the Elasticsearch family.
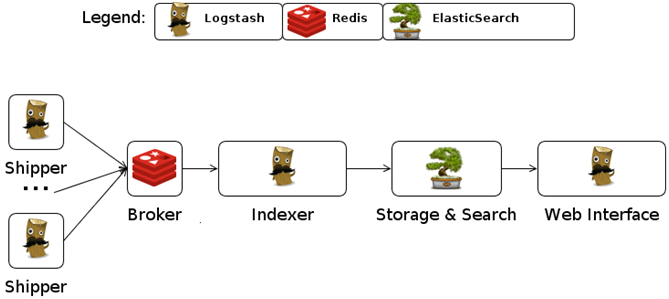
How it works ?
The shipping agent ships logs from the source which you can collect in an queuing agent. It also acts a buffer, used for indexing and searching from Web UI.
Setting up Logstash
Setting up logtash is very simple. You are only required to configure a Shipper, a Collector, an Indexer and a Web UI.
Now we’ll demonstrate this by sending Apache access logs.
Prerequisites :
- Java > 1.5
- ElasticSearch
- Redis
Elasticsearch :
- Download elastic search from its official website.
- Extract the source and
- Run elasticsearch
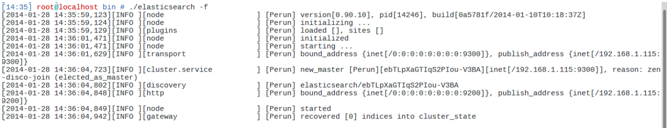
[shell]/bin/elasticsearch -f[/shell]
You can see the output as Elasticsearch initializes the master node, which will be something like:
Redis :
We will be using Redis to collect the logs.
If you are not familiar with Redis installation and configuration process , simply follow the instructions mentioned below:
- Download Redis from http://redis.io/download (The latest stable release is likely what you want)
- Extract the source, change to the directory and run make.
- Run Redis with
[shell]src/redis-server –loglevel verbose[/shell]
To verify redis installation and its functioning:
[shell]redis-cli info memory[/shell]
Setting up Shipper :
First download the logstash Agent from http://logstash.net/.
Now specify the Logstash agent to ship the logs in JSON format to our Collector (Redis).
[shell]
input {
file {
# Change this to *-log according to the location where logs are being generated
type => "prod-log"
# Change this to be the location where log files are being generated
path => [ "/var/log/httpd/*.log"]
}
}
Output {
stdout { debug => true debug_format => "json"}
redis { host => "127.0.0.1" data_type => "list" key => "logstash" }
}
[/shell]
Now, save this file as shipper.conf and start the Shipper service :
[shell]java -jar logstash.jar agent -f shipper.conf[/shell]
Configuring Collector and Indexer :
Now, we will index the logs that are being collected in redis to our elasticsearch instance.
[shell]
input {
redis {
host => "127.0.0.1"</em>
type => "redis-input"</em>
data_type => "list"</em>
key => "logstash"
message_format => "json_event"
}
}
output {
stdout { debug => true debug_format => "json"}
elasticsearch {
host => "127.0.0.1"
port => 9300
}
}
[/shell]
Save this file as index.conf and run the logstash agent :
[shell]java -jar logstash.jar agent -f indexer.conf[/shell]
Configuring the Logstash Web UI :
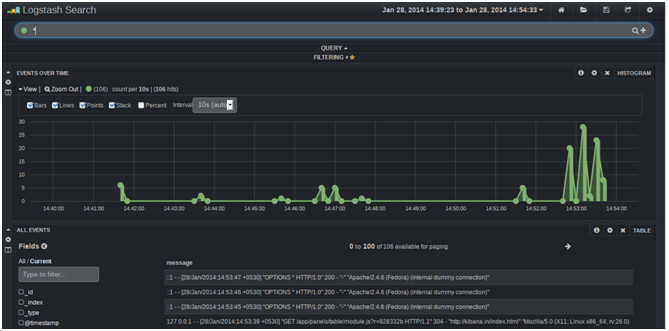
I’ll be using Kibana to view the logs as it has a nice user interface and you can also customize it as per your requirements.
You can download kibana from : https://github.com/elasticsearch/kibana
After downloading
- edit the config.js file and update the location of your elasticsearch server. While updating, keep in mind that the location should be accessible via your web browser.
- Rename the app/dashboards/logstash.json to app/dashboards/default.json
Now we have to host kibana to run on our web server. I’m skipping this part as you all will already be familiar will this process.
After configuring your webserver, open the application in your web browser and access your Application Error logs.
Post-Setup Configurations :
This was a simple configuration, but before using it on your production environment you must tune the Elasticsearch parameters and you can also think of distributing the load using separate instances for Redis and adding more Elasticsearch Nodes.


FYI, as an “operations guy” i suggest involving your “development team” in the architecture of this software solution. 😉
Nice blog 🙂 But one should use a recent java 1.7 version from oracle (especially avoid using openjdk) and that is too on all the nodes in the elasticsearch cluster to avoid some unrealistic bugs/exceptions. 😉