Step-by-Step Guide to Build observability into an LLM application
Introduction
Large Language Models (LLMs) are transforming the way that users interact with applications, and they introduce observability challenges that require new approaches. Unlike deterministic APIs that return predictable results, LLMs have variable performance, unpredictable outputs, and complex failure modes. Observing these systems effectively means collecting data that captures not just the performance of LLM requests, but also the content of those requests and responses, the flow of data through your application, and the costs associated with using LLM services.
Objective
By the end of this blog, you’ll be able to do the following:
- Enable LLM Observability in your LLM application using Datadog’s tracing libraries.
- Observe the performance of the LLM in the context of your application using metrics for latency, token usage, and errors.
- Find errors and fixed root causes using observability data.
What is LLM Observability?
Large Language Models (LLMs) are a type of artificial intelligence model that can process and produce natural language text. These are trained on large amounts of text data such as books, articles, and web pages that allow them to recognize patterns in language.
Integrating an LLM into an application can provide functionality like the following:
-
- Chatbots and assistants.
- Code generation and Content creation.
- Text summarization or translation.
Challenges and Complexity of LLM Applications
- When you integrate LLMs into applications, you encounter operational complexities that are similar to those with traditional distributed systems, but with unique visibility challenges.
- The details of response generation in LLM applications can be opaque, making it difficult to diagnose issues or optimize performance. Subtle error conditions and quality issues are hard to troubleshoot. Costs can spiral out of control, and security vulnerabilities can expose sensitive data.
- An LLM-powered chatbot may fail silently, providing irrelevant responses due to subtle issues in the prompt or model configuration. Detailed tracing can connect the dots between user input, model responses, and application logic, helping you identify the root cause of these issues.
- Confident but incorrect responses, known as “hallucinations,” are common problems with LLMs. This can lead to user frustration and mistrust. Observability helps you track the quality of responses over time, identify patterns in hallucinations, and improve prompt engineering or model selection.
- LLM applications can be vulnerable to attacks like prompt hacking and unintentional data leaks.
- LLM costs can escalate quickly in production, since LLM pricing is typically based on token usage (units of text processed by the model). Monitoring usage metrics for token consumption is crucial to controlling costs.
LLM traces and metrics
- LLM Observability solves these visibility challenges by providing clear insight into the operations of your LLM applications. The collected data gives you the necessary information to diagnose issues, optimize performance, and manage costs effectively.
- Datadog LLM Observability works by instrumenting your application code to automatically collect data about LLM requests. When you add the Datadog tracing library and the necessary configuration, Datadog captures each step in an LLM workflow.
- LLM Observability lets you see exactly what’s going on in the operations of your LLM applications. Collected traces give you aggregated data that can be searched, filtered, and grouped to help you focus on specific aspects of application performance and troubleshoot issues across all your LLM requests.
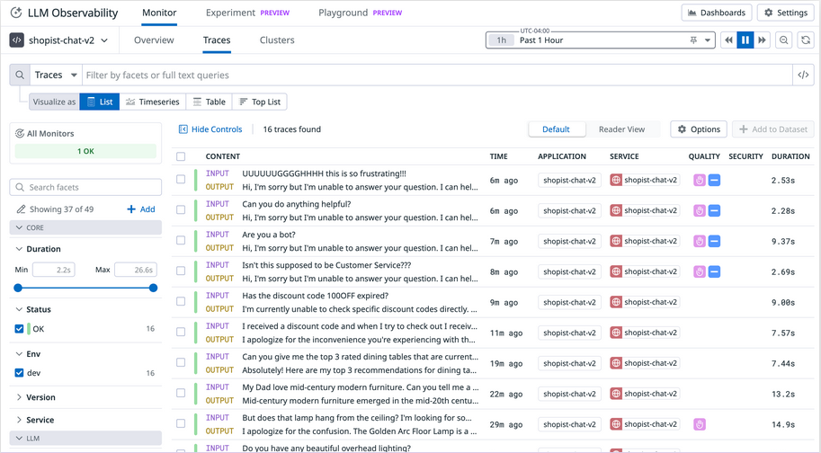
Traces list view showing traces for a chat service
- Trace data for each individual request includes full prompt input and response output, metrics for latency and token use, and details about any errors that occur.
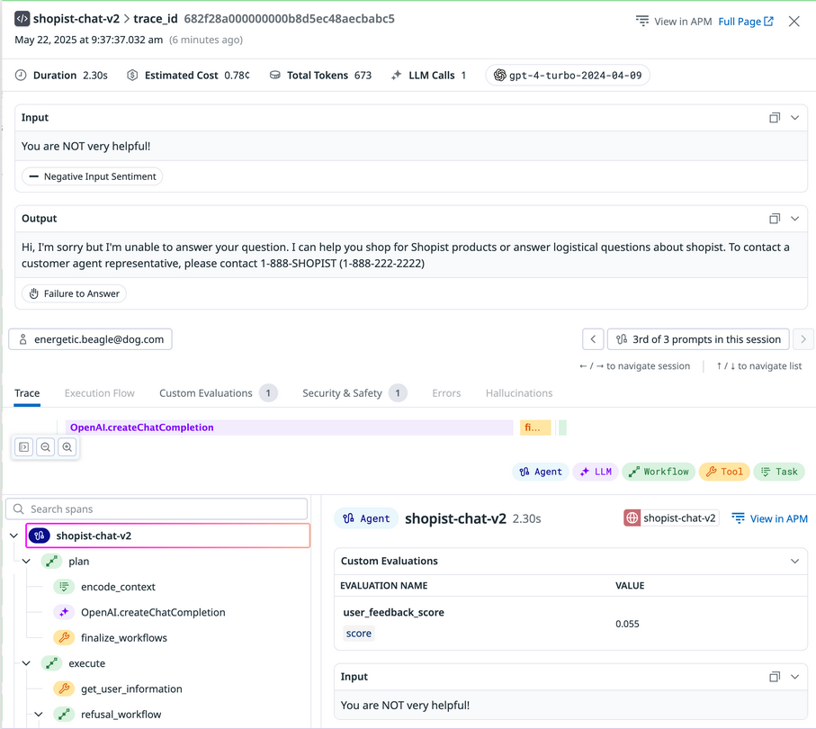
Trace detail view showing a specific trace for a service request
- LLM Observability visualizes metrics to help you identify trends and patterns across requests, such as changes in request volume, recurring errors, or variations in response times.
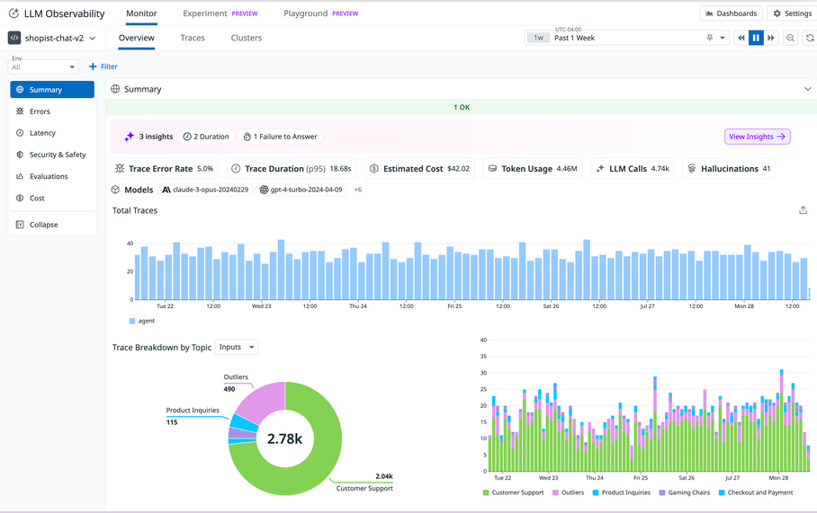
LLM Observability Overview showing a timeseries graph for Total Traces, a pie chart showing Trace Breakdown by Topic Inputs, and a bar graph showing the same Trace Breakdown by Topic Inputs data
Datadog’s tracing library and Auto-instrumentation
- The Datadog tracing library is a collection of language-specific tools that automatically instruments your application code to capture and send detailed performance data (traces) to Datadog. Through the LLM Observability SDKs for Python, Java, and Node.js, the tracing library monitors LLM calls, token usage, duration, errors, and prompt-response pairs.
- Auto-instrumentation means that you don’t have to make any changes to your code, and you can start seeing LLM traces immediately after enabling LLM Observability in your application, with minimal configuration.
- The tracing library automatically captures calls from a wide range of LLM providers, platforms, and frameworks. The following list includes some of the many supported integrations:
- OpenAI, Azure OpenAI, and Anthropic
- Amazon Bedrock and Google Vertex AI
- LangChain, LangGraph, and Crew AI
- OpenAI Agents and Amazon Bedrock Agents
- MCP (Model Context Protocol)
- Auto-instrumentation provides immediate visibility for straightforward LLM integrations, and as your applications grow more sophisticated, incorporating retrieval-augmented generation, multi-step chains, or agent-based workflows, you can extend your observability using Datadog’s SDK to trace custom components and complex execution paths.
LLM Observability
- LLM Observability works similarly to Application Performance Monitoring (APM) distributed tracing, capturing request timing, service details, and error rates. Additionally, it records the complete prompts, responses, and token usage for each LLM interaction.
- Each LLM trace represents a single LLM interaction and contains several types of data:
- Request and Response Content
- Token Metrics
- Error Information
- Performance Metrics
- In Datadog, you’ll see traces presented in a list format. From there, you can begin to examine individual traces more closely or group traces according to specific criteria that you’re interested in.
Spot anomalies and correlations in metric data
- Application Overview visualizations can help you quickly find a focus for your investigation before diving into individual traces. The application Overview includes an Errors section with graphs such as All Errors by Error Type, Top Errors by Error Type, Error Rate by Topic (for Inputs or Outputs), and Top Errors by Span Name.
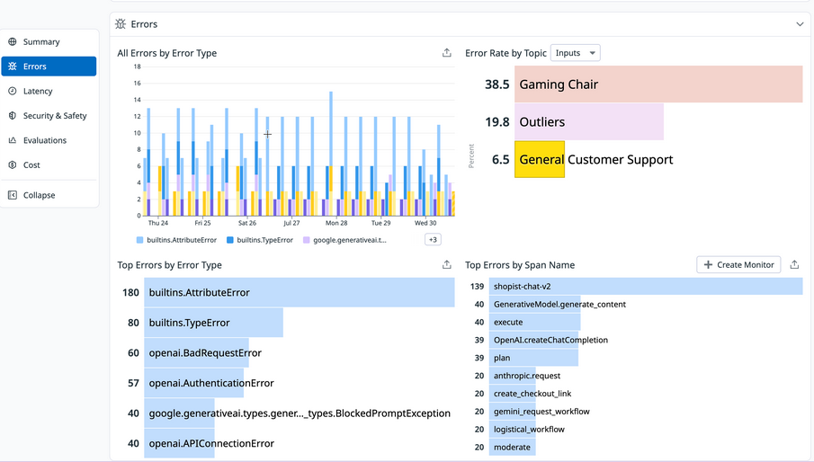
LLM Observability Overview showing error metrics including error rate graphs and top errors by type.
- On the same Overview in the Latency section, you can see visualizations for application latency, including a timeseries graph for Trace Latency; top lists for Slowest Spans by Average Latency and Average Trace Latency by Topic; and a table showing Latency by Model.
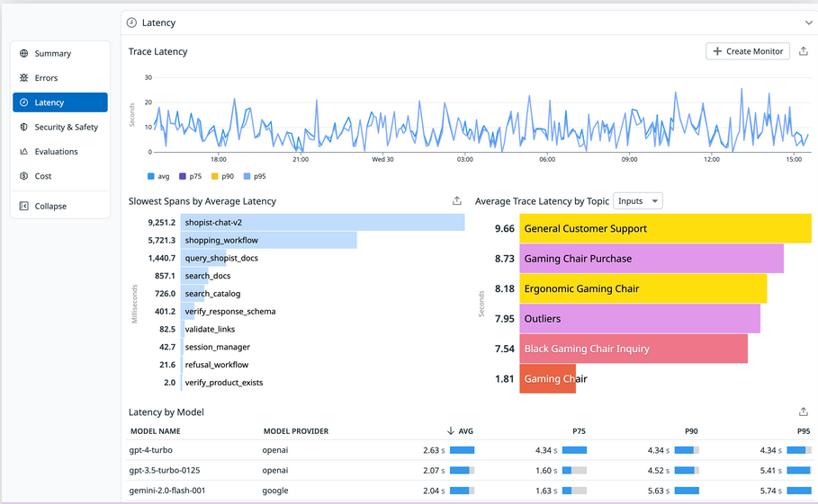
LLM Observability Overview showing latency metrics including trace latency graph and slowest spans list.
- The Cost section of the Overview gives you the option to view a timeseries graph of Cost per Trace (or Span) in Tokens or Dollars, a top list of Most Expensive Spans, and tables for Most Expensive Models by Cost and Most Expensive Models by Token Count.
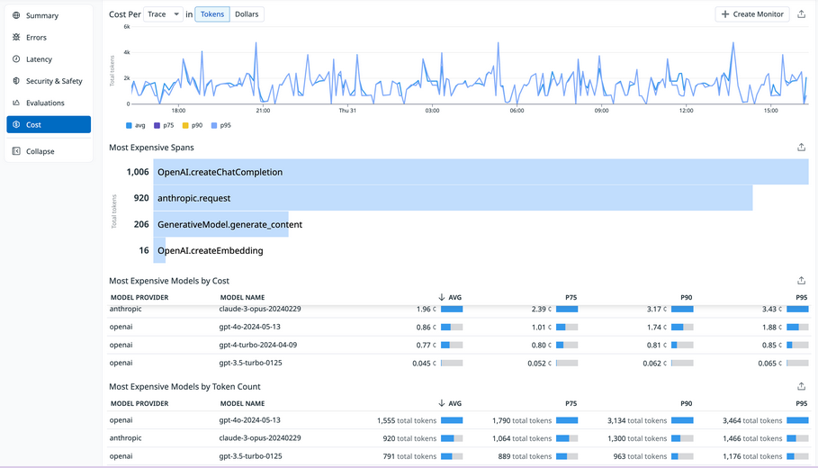
LLM Observability Overview showing cost metrics including cost per trace graph and most expensive spans list.
- In the early stages of your investigation of possible issues, you can use these graphs to see if meaningful patterns emerge.
- For example, if the Error Rate by Topic graph shows certain input categories consistently failing while others succeed, this could point to issues with the prompt rather than wider systemic problems. Or the Latency by Model table might reveal that specific models are experiencing delays, and you could then filter the traces list to see the details of requests linked to those specific models.
Analyze LLM trace details
- As the focus of your investigation sharpens, you can examine individual trace details that contain the complete information and metadata for a single LLM request.
- Complete request and response data: The exact prompts sent to the LLM and the full responses returned
- Token usage metrics: Input tokens, output tokens, and total tokens consumed for cost tracking
- Timing information: The duration of the request, helping identify performance issues
- Model name: The specific model that was used for the request
- Error details: Full error messages and stack traces when LLM calls fail
- This level of detail allows you to spot misconfigurations, invalid parameters, or other problematic request data. Specific error messages and stack traces can point you directly to the root cause of any errors.
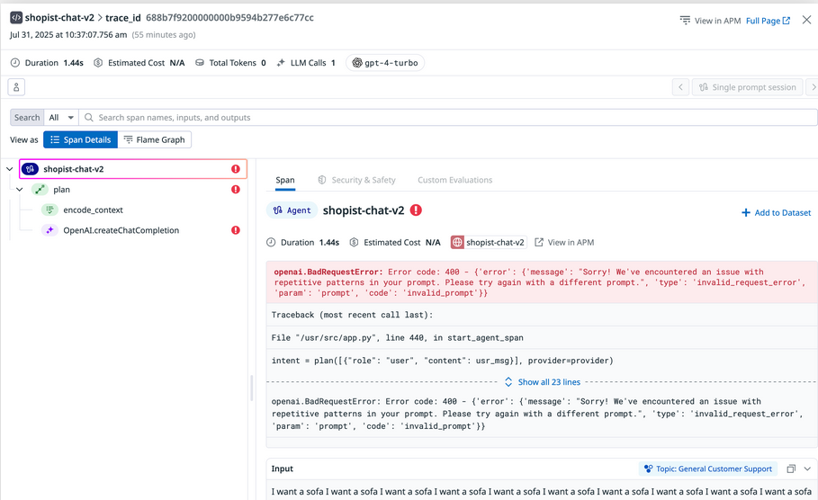
LLM trace details showing error information with highlighted error message and request metadata.
- For complex LLM applications using sequences of interconnected calls and tools, this visualization lets you pinpoint exactly where issues occur across multi-step workflows.
Conclusion
LLMs and the possibilities of AI-powered applications are constantly and rapidly evolving.
You’re now able to do the following:
- Enabled LLM Observability in your LLM application using auto-instrumentation with the OpenAI Python client
- Explored trace data containing the inputs and outputs of LLM calls and other relevant metadata
- Observed the performance of the LLM in the context of your application using metrics for latency, token usage, and errors
- Identified errors in LLM applications and tracked down root causes using observability data