Getting started with AWS RUM
In today’s world of Application and website usage, almost everyone is using some or other application or website, so it becomes essential for an organization to understand how the application/website is being used at the end user end, what improvisation that can be done to improve end-user experience.
Real User Monitoring (RUM) in AWS (Amazon Web Services) is implemented to gather insights into how real users interact with and experience your website or application. This approach provides valuable data to help optimize and improve user satisfaction.
With CloudWatch RUM, you can perform real user monitoring to collect and view client-side data about your web application performance from actual user sessions in near real-time. The data that you can visualize and analyze includes page load times, client-side errors, and user behavior. When you view this data, you can see it all aggregated together and breakdowns by the browsers and devices your customers use.
Benefits of AWS RUM
User-Centric Monitoring: RUM provides a user-centric perspective of website performance. You see how real users experience your site, allowing you to address issues that directly impact them.
Identify Performance Issues: RUM reveals performance bottlenecks, slow-loading pages, and errors in real-time. This information allows you to quickly address issues, leading to better user experiences.
Prioritize Improvements: RUM data helps you prioritize improvements based on what matters most to users. You can focus on the critical user flows and interactions.
Data-Driven Decision Making: RUM provides quantitative data for decision-making. You can use this data to validate the impact of changes and make informed decisions about optimizations.
Enhanced User Satisfaction: By proactively addressing performance issues, you can improve user satisfaction, reduce bounce rates, and increase user engagement.
Continuous Optimization: RUM facilitates continuous performance optimization. Regular monitoring allows you to keep the website running smoothly even as traffic and user patterns change.
Prevent Revenue Loss: Faster, error-free websites often lead to better conversion rates, preventing revenue loss due to poor user experiences.
Security and Privacy: While benefiting the website, ensure that RUM implementations respect user privacy and comply with applicable data protection regulations.
Data Retention in AWS RUM
End user data that you collect for CloudWatch RUM is retained for 30 days and then automatically deleted. If you want to keep the RUM events longer, you can have the app monitor send copies of the events to CloudWatch Logs in your account. Then, you can adjust the retention period for that log group.
Usage of AWS RUM
To use RUM, you create an app monitor and provide some information. RUM generates a JavaScript snippet for you to paste into your application. The snippet pulls in the RUM web client code. The RUM web client captures data from a percentage of your application’s user sessions, which is displayed in a pre-built dashboard. You can specify what percentage of user sessions to gather data from.
Performance Consideration of AWS RUM
- Load performance impact— The CloudWatch RUM web client can be installed in your web application as a JavaScript module or loaded into your web application asynchronously from a content delivery network (CDN). It does not block the application’s load process. CloudWatch RUM is designed for there to be no perceptible impact on the application’s load time.
- Runtime impact— The RUM web client performs processing to record and dispatch RUM data to the CloudWatch RUM service. Because events are infrequent and the amount of processing is small, CloudWatch RUM is designed for there to be no detectable impact on the application’s performance.
- Network impact— The RUM web client periodically sends data to the CloudWatch RUM service. Data is dispatched at regular intervals while the application is running, and also immediately before the browser unloads the application. Data sent immediately before the browser unloads the application are sent as beacons, which are designed to have no detectable impact on the application’s unload time.
How Data is Collected
- As users visit your website, the JavaScript/HTML code collects data and sends it to the RUM tool’s server or AWS CloudWatch, depending on your choice.
- This data can include page load times, browser details, network latency, user interactions (clicks, form submissions), errors encountered, and more.
- Configure which data you want to collect and monitor. Dashboards are available to display the collected RUM data. This allows you to gain insights into user experience trends and issues.
- Analyze data to identify performance bottlenecks, errors, and areas for improvement.
Step to configure RUM Monitoring over AWS
Step 1: Click on Add Monitor
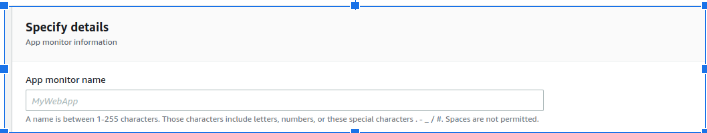
Step 2: Provide a App monitor name, this cannot be changed once created and is solely for the user perspective and can be anything, including letters, numbers, or these special characters . – _ / #. Spaces are not permitted.
Step 3: Provide the Application domain name on which the RUM is to be setup; this domain should be top-level domain like google.com as the domain name will be able to monitor mail.google.com, photos.google.com etc; the only condition is to include sub-domains option as selected but if we put domain name as mail.google.com it will be able to monitor only mail.google.com and not any other domain
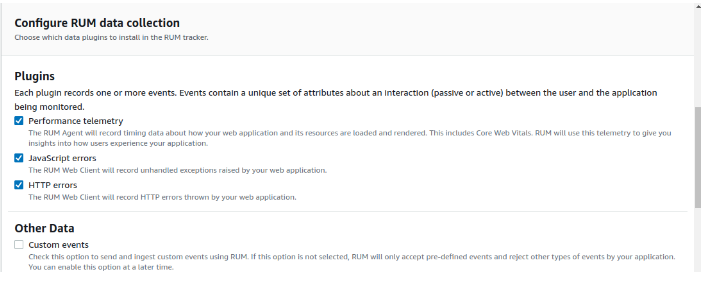
Step 4: Selecting RUM data collection
Data plugins to install in the RUM tracker
Available plugins:
Performance telemetry – The RUM Agent will record timing data about how your web application and its resources are loaded and rendered. This includes Core Web Vitals. RUM will use this telemetry to give you insights into how users experience your application.
JavaScript errors – The RUM Web Client will record unhandled exceptions your web application raises.
HTTP errors – The RUM Web Client will record HTTP errors thrown by your web application.
We can have other custom events as well as accept pre-defined events and reject other types of events by your application.
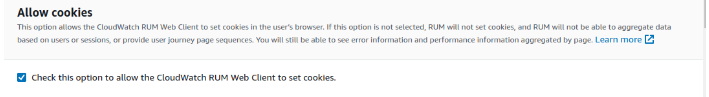
Step 5: CloudWatch RUM Web Client to set cookies in the user’s browser. If this option is not selected, RUM will not set cookies, and RUM will not be able to aggregate data based on users or sessions, or provide user journey page sequences. You will still be able to see error information and performance information aggregated by page.
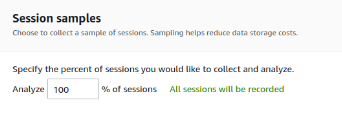
Step 6: Select the Percentage of Sample sessions we want to collect and analyze.
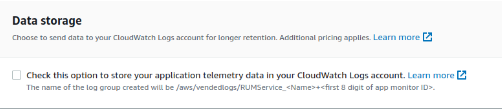
Step 7: Storage of application telemetry data in CloudWatch Logs account – The name of the log group created will be /aws/vendedlogs/RUMService_<Name>+<first 8 digits of app monitor ID>
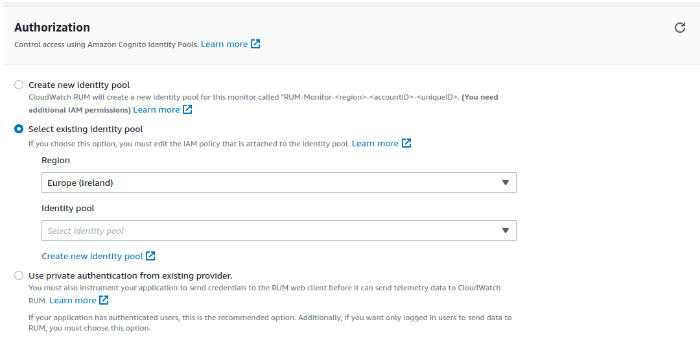
Step 8: Select type of authorization that we would like to use so that the script can have data stored over RUM.
Types of Authorization are mentioned below
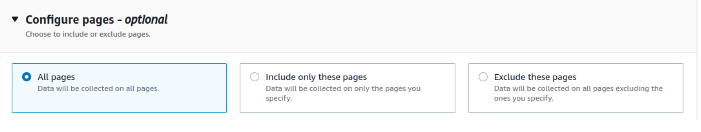
Step 9: Configuring pages from which we need data, We can select pages that we need data from. There are 3 options that are available for this.
All Pages, Include Pages, Exclude Pages.
We are done with the RUM configuration over AWS, and we will start receiving data over RUM whenever there is sufficient usage of the Website/Web Application.