CloudWatch Logs Monitoring
AWS has launched a new feature for monitoring cloud trail logs (CloudWatch Logs). CloudWatch Logs lets you monitor and troubleshoot your systems and applications using your existing system, application and custom log files. CloudWatch Logs can be used to monitor your logs for specific phrases, values or patterns. It has removed the dependency of third party tools which were used for monitoring the logs and creating alarms.
Steps To Configure CloudWatch Logs Monitoring
1. Create a Log Group or Specifying an Existing Log Group
You can specify an existing CloudWatch Logs log group or have CloudTrail create a new one
Note: When you create a new Log group make sure that you have changed the Log group name in the default policy also.
2) Specify a Role
AWS CloudTrail will assume the role you create or specify to deliver CloudTrail events to your CloudWatch Logs log group
3) Create a Policy Document
You need to attach a trust policy with Role that grants CloudTrail the required permissions to create a CloudWatch Logs log stream in the log group that you specify and to deliver CloudTrail events to that log stream.
[js]
{
"Version": "2012-10-17",
"Statement": [
{
"Sid": "AWSCloudTrailCreateLogStream20141101",
"Effect": "Allow",
"Action": [
"logs:CreateLogStream"
],
"Resource": [
"arn:aws:logs:us-east-1:XXXXXXXXXXX:log-group:CloudTrail/DefaultLog:log-stream:XXXXXXXXXXXX_CloudTrail_us-east-1*"
]
},
{
"Sid": "AWSCloudTrailPutLogEvents20141101",
"Effect": "Allow",
"Action": [
"logs:PutLogEvents"
],
"Resource": [
"arn:aws:logs:us-east-1:XXXXXXXXXXXX:log-group:CloudTrail/DefaultLog:log-stream:547691642739_CloudTrail_us-east-1*"
]
}
]
[/js]
Once you completed these steps your CloudWatch Logs Monitoring will be configured.
Creating Metric Filter
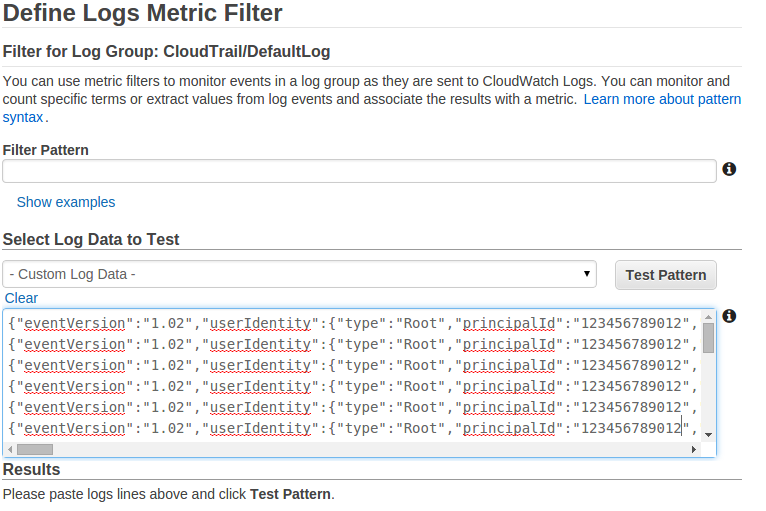
here in place of -Custom Log Data- you need to select your log data in drop down options which you want to test
Metric Filters
Metric Filters are the filters that we apply on the log streams to get valuable information from the stream of logs. Metric filters are assigned to log groups and all of the filters assigned to a log group are applied to their log streams. For ex-you can create a Metric Filter for an event that you want to monitor on a regular basis
Filter and Pattern Syntax
You can use metric filters to search for and match phrases or values in your log events. When a metric filter finds one of the phrases or values in your log events, it counts each occurrence in a CloudWatch metric
Syntax for Filter pattern are:
{ SELECTOR EQUALITY_OPERATOR STRING }
where
SELECTOR specifies what JSON property to check. Property selectors always start with dollar sign ($), which signifies the root of the JSON
EQUALITY_OPERATOR can be either = or !=
STRING is the value of that selector which you want to match in the log events.We can refer a string from the json format of the log events in the log stream.
for example: The following filter will look for all those events that are concerned with Security groups in your account.
{ ($.eventName = AuthorizeSecurityGroupIngress) || ($.eventName = AuthorizeSecurityGroupEgress) || ($.eventName = RevokeSecurityGroupIngress) || ($.eventName = RevokeSecurityGroupEgress) }
[js]
{
"eventVersion":"1.02",
"userIdentity":{
"type":"Root",
"principalId":"XXXXXXXXXXXX",
"arn":"arn:aws:iam::XXXXXXXXXXXX:root",
"accountId":"XXXXXXXXXXXX",
"accessKeyId":"UUSDFFB123JBJSJF",
"sessionContext":{
"attributes":{
"mfaAuthenticated":"false",
"creationDate":"2015-03-19T05:09:01Z"
}
}
},
"eventTime":"2015-03-19T06:25:34Z",
"eventSource":"ec2.amazonaws.com",
"eventName":"AuthorizeSecurityGroupIngress",
"awsRegion":"us-east-1",
"sourceIPAddress":"132.60.25.13",
"userAgent":"console.ec2.amazonaws.com",
"requestParameters":{
"groupId":"sg-6b5ec11d",
"ipPermissions":{
"items":[
{
"ipProtocol":"tcp",
"fromPort":24,
"toPort":24,
"groups":{
},
"ipRanges":{
"items":[
{
"cidrIp":"122.160.25.26/20"
}
]
},
"prefixListIds":{
}
}
]
}
},
"responseElements":{
"_return":true
},
"requestID":"2g7633d1-c9d6-4089-99b1-2cedeff209af",
"eventID":"c0d1b7b0-0b73-47d7-b6b6-0ca8b1bb24b6",
"eventType":"AwsApiCall",
"recipientAccountId":"xxxxxxxxxxxx"
}
[/js]
Steps to create Metric Filter
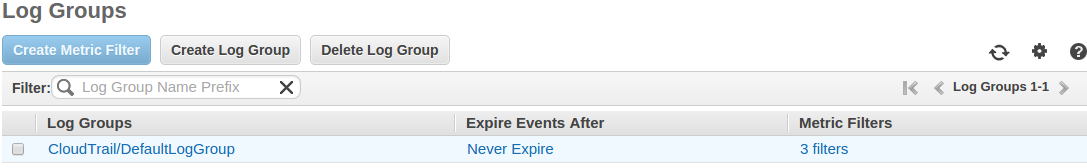
1. On cloud watch dashboard select Logs tab.
2. Select the Log group checkbox on which you want to assign a metric filter and click on Create Metric Filter
3. Enter the filter pattern and Assign the Metric.
4. On next page, create Metric Namespace where Namespaces let you group similar metric
5. Enter the Metric Name from which you want to access the metric for further use.
6. In Advance Settings enter the metric value where Metric Value is the value published to the metric name when a Filter Pattern match occurs.
7. At last click on Metric Filter.
CloudWatch Alarms
We can configure CloudWatch Logs to send a notification whenever an alarm is triggered for CloudTrail.CloudWatch uses Amazon Simple Notification Service (SNS) to send email.
Steps to create CloudWatch Alarms are :
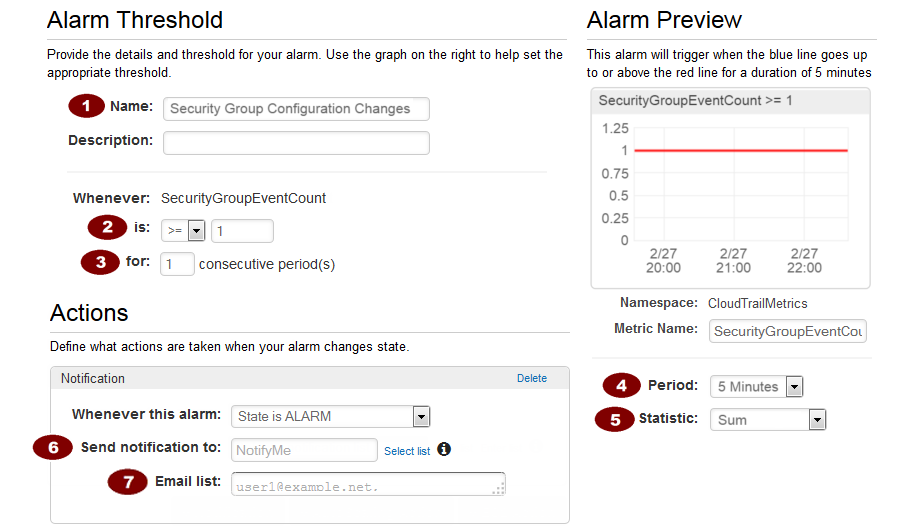
1. On the Filters for Log Group Name page, next to the filter name, click Create Alarm.
2. On the Create Alarm page, provide the following values.
Keys Points
1.The event only looks for last 50 API calls and this gets rolled over quickly due to describe calls.
2.The Alarm initially goes in Insufficient state because the metric need some data to process. You need to trigger an event so that the filter that you had described matches the pattern in log data.
3.Alarm history is available for 14 days.
4.You can use CloudWatch Logs to store your log data for as long as you need in highly durable manner.
Refrences: http://aws.amazon.com/documentation/