What is CloudWatch Dashboard
Amazon CloudWatch dashboards are customizable home pages in the CloudWatch console that you can use to monitor your resources in a single view, even those resources that are spread across different Regions. You can use CloudWatch dashboards to create customized views of the metrics and alarms for your AWS resources.
Problem Statement
How to monitor and get the statistics of the custom metrics of your applications and other metrics not provided by AWS by default !!
Solution
Create a Metric filter for the log group where the logs are being captured for the required data. Create a graph from that metric and add it to the Dashboard.
Steps to create a CloudWatch custom Dashboard
- Create a Metric filter
- Create a graph and add it to the Dashboard.
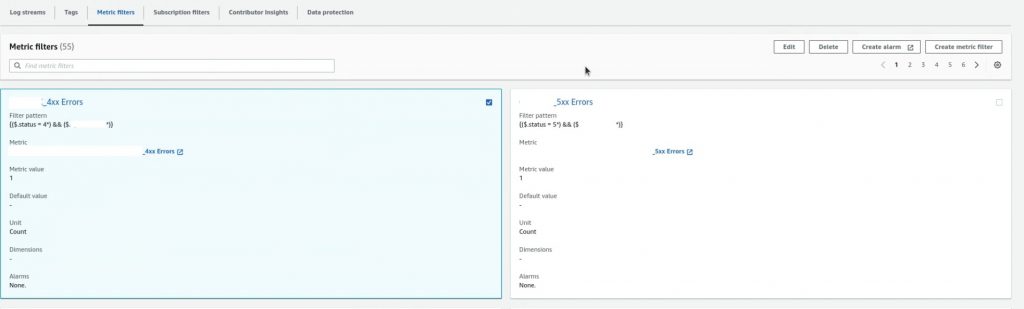
Create a metric filter for a log group.
- Go to Log Groups inside CloudWatch. Click on the Log group where the required data is being captured. Click on Metrics filters and Create a metric filter.
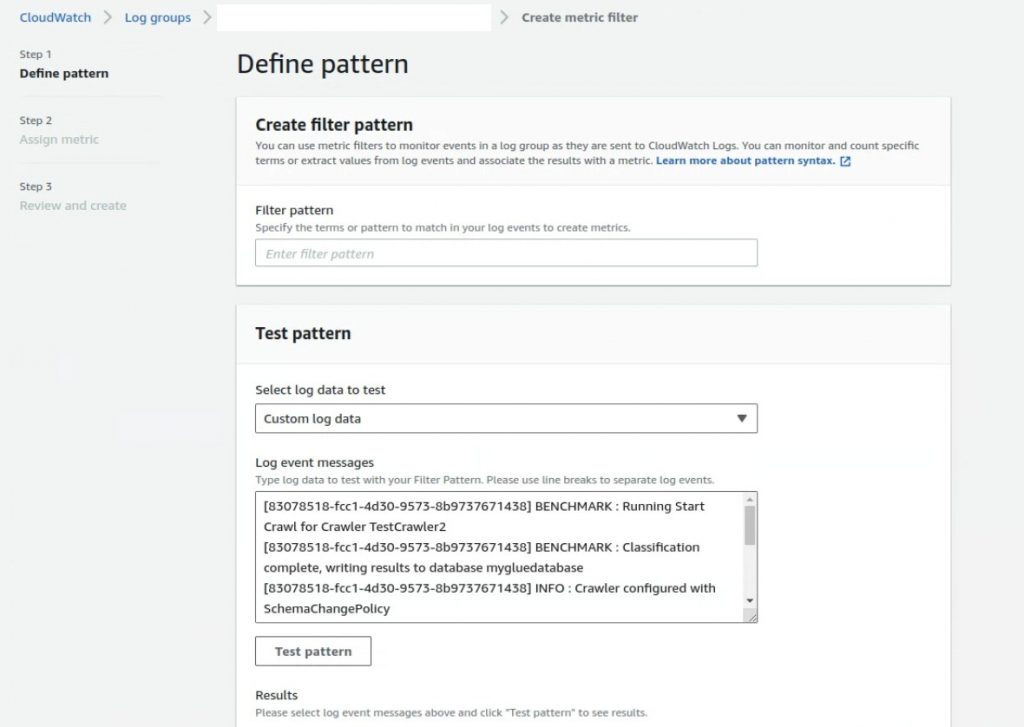
2. Enter the pattern that you want to filter in the Filter Pattern field.
In the Test Pattern, leave it as Custom log data as shown below, and click on Next.
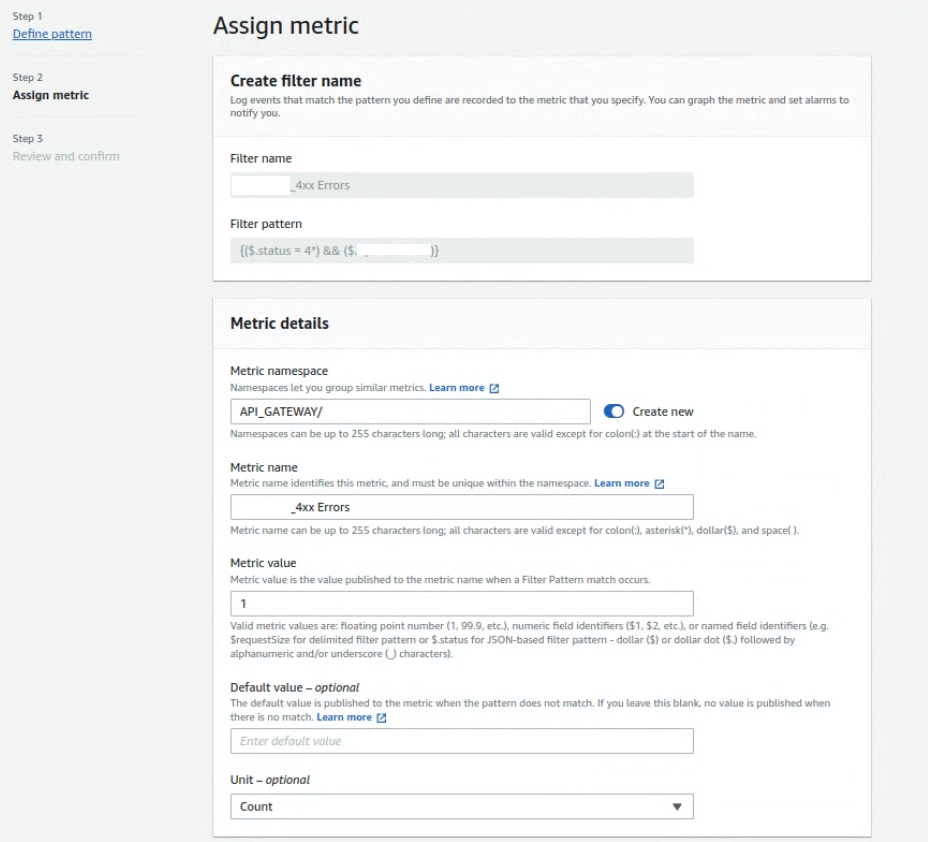
3. Enter the details; you can take reference from the below screenshot and click on Next
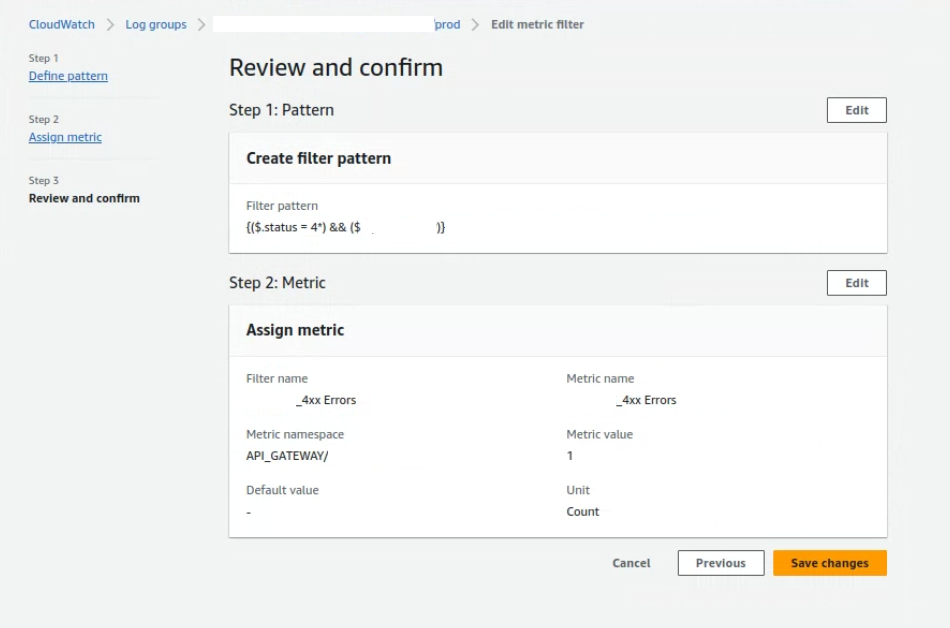
4. In the next page, we need to review and confirm the metric filter by clicking on save changes
Create a graph and add it to the Dashboard
- Allow some time to get the traffic populated in that metric filter.
- Go to the metric filter which we created in the above steps. And click on Metric values as highlighted in the screenshot below.
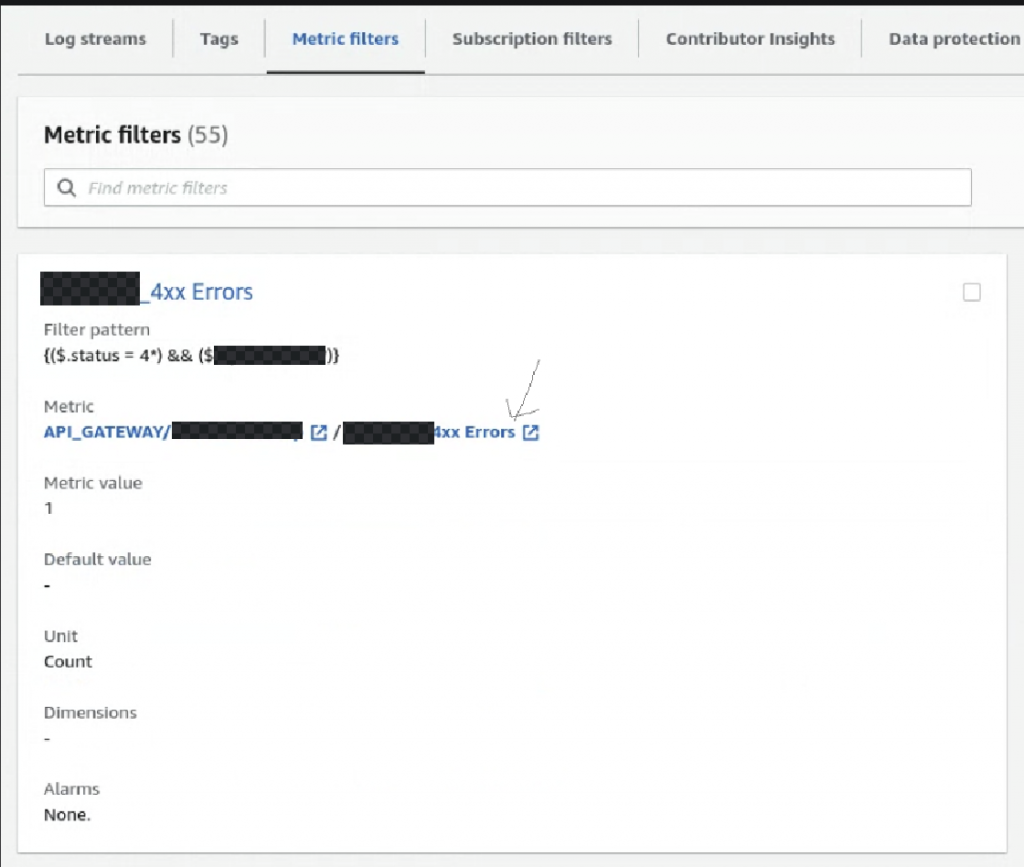
3. The page below will appear After clicking on the Metric highlighted above.
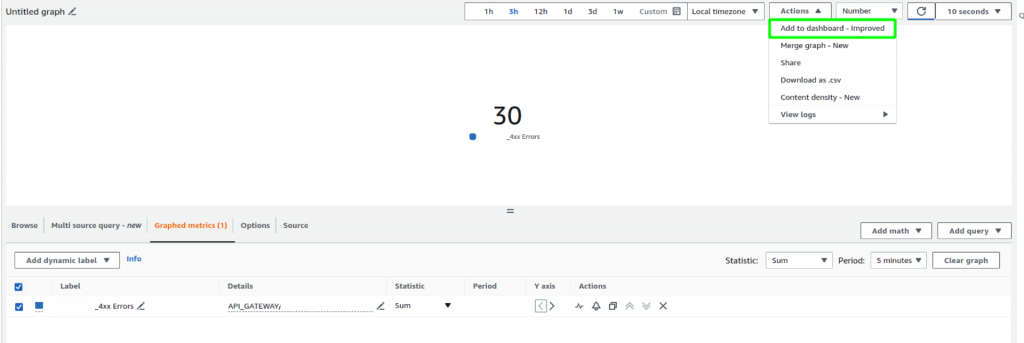
Configure the Statistics and other graph options and click “Add to dashboard” as marked above.
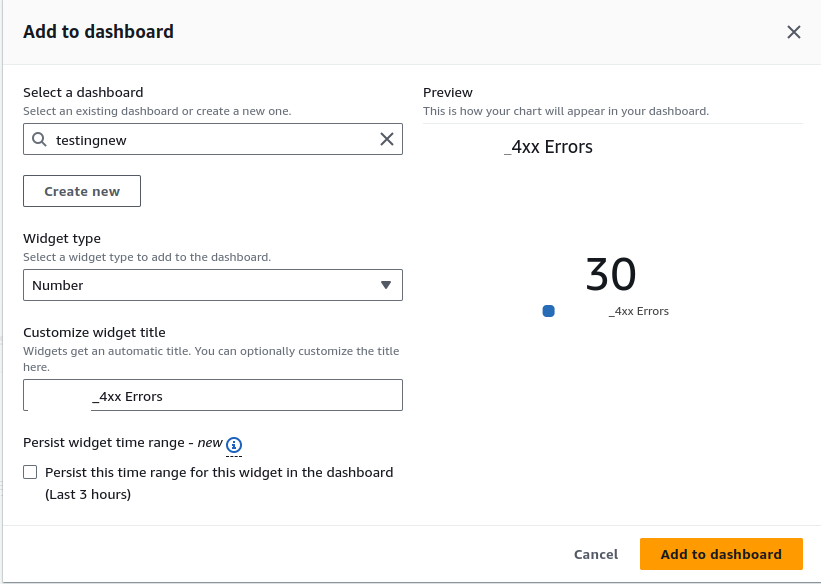
4. Either select an existing dashboard or create a new dashboard as seen below.
Widget titles can be customized by entering the new title in the below option. Click on Add to Dashboard.
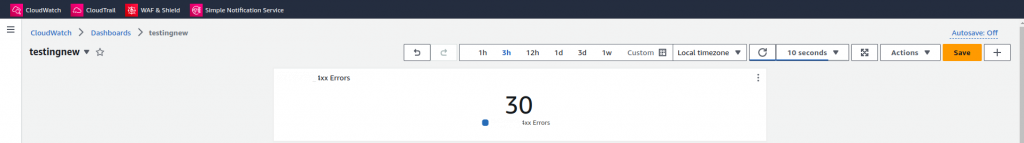
5. After clicking on Add to dashboard, the page below will appear. Click on the save button and the dashboard will be created.
Conclusion
This blog demonstrates how to create a CloudWatch dashboard using the custom metric filters on the log groups. It helps to visualize the customized data that is being generated in the log groups.