The AWS re:Invent 2015 has brought with itself a lot of new iterations of services and a lot of new services as well. One such iteration of AWS CloudWatch is the AWS CloudWatch Dashboards.
Any of you who might have used tools like Datadog would definitely have heard of metric Dashboards where you can create you custom Dashboards. Similar is the case with AWS CloudWatch Dashboards. It can be better understood as AWS CloudWatch metrics Dashboards. The steps I have followed in the blog can be followed to group any set of metrics and it is actually very useful and saves a lot of time.

Use-case
I had a simple use-case. I was monitoring the LOAD average of my servers. So, If I had to look at many metrics together I firstly had to search them in the search box and then select them one by one. It was becoming a very tedious process. There was nothing to save this selection in the AWS Console. So, I decided to try the new AWS CloudWatch Dashboards. So, what I did is as follows.
Steps
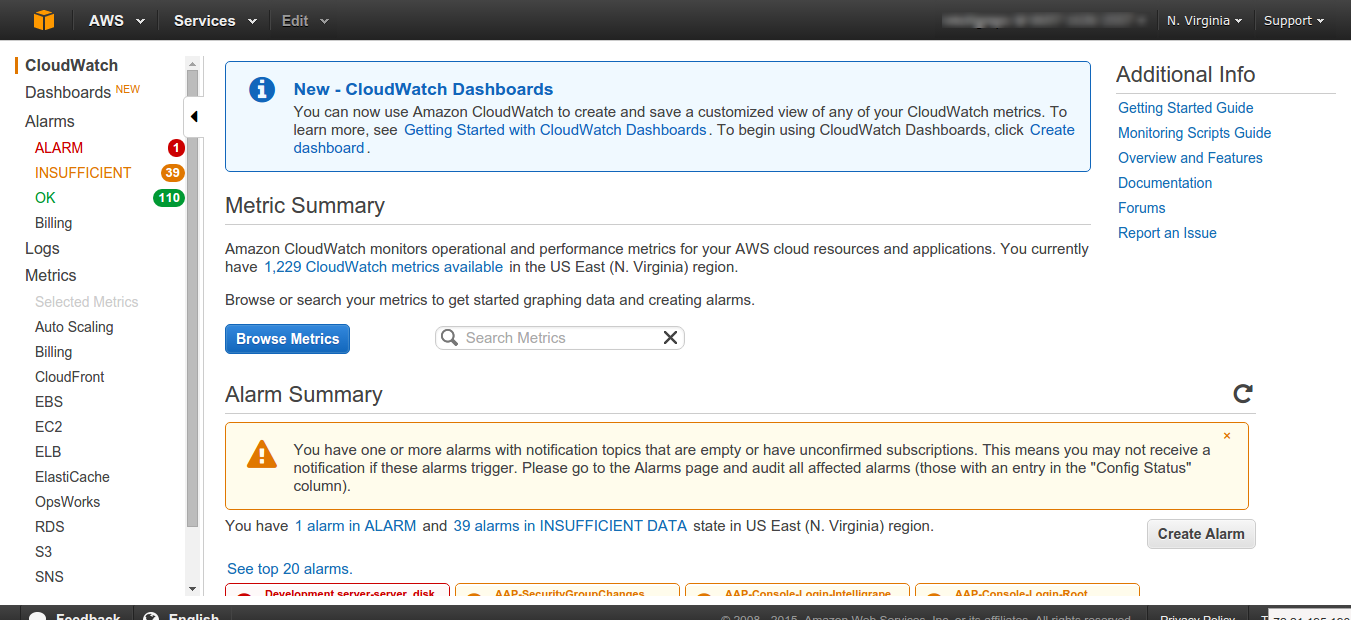
1. Just Login to your AWS account and head to the AWS CloudWatch service:
Next, Click on Dashboards on the left-hand side and it should open this:
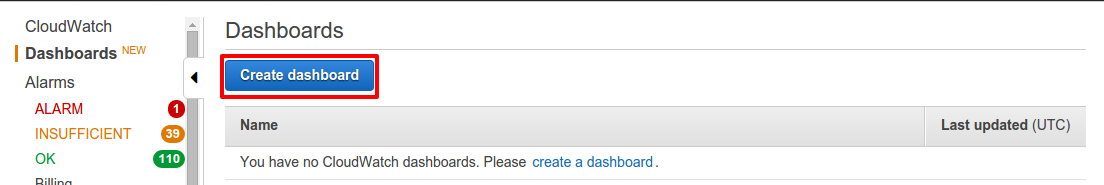
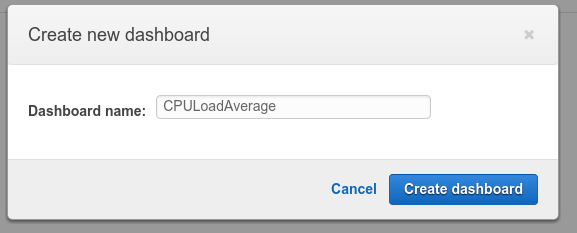
Click on Create dashboard. It will pop out an option to name your Dashboard. Enter a name of your choice and click on Create dashboard:
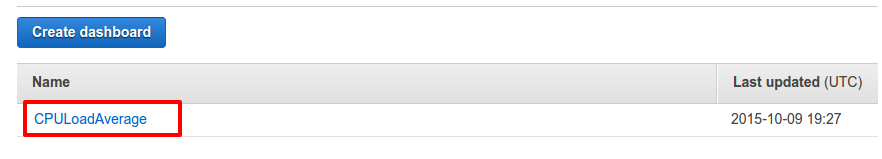
2. Now, you will see that the new Dashboard is created. You need to configure it. Click on the dashboard name:
Now, you will be taken to the dashboard page. Click on Add widget to add a widget containing multiple metrics:

Clicking will throw a pop out like:
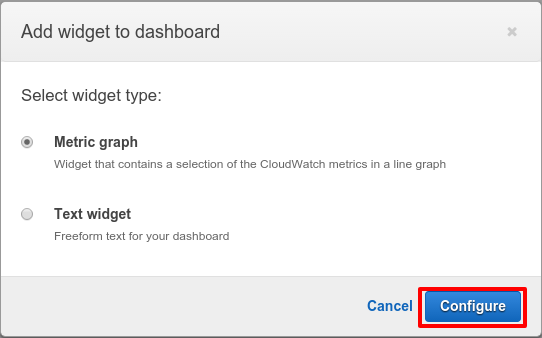
Just select Metric graph and click on Configure. It will again pop out and this time will show you all the available metrics namespaces in your account. We are interested in Linux/System:
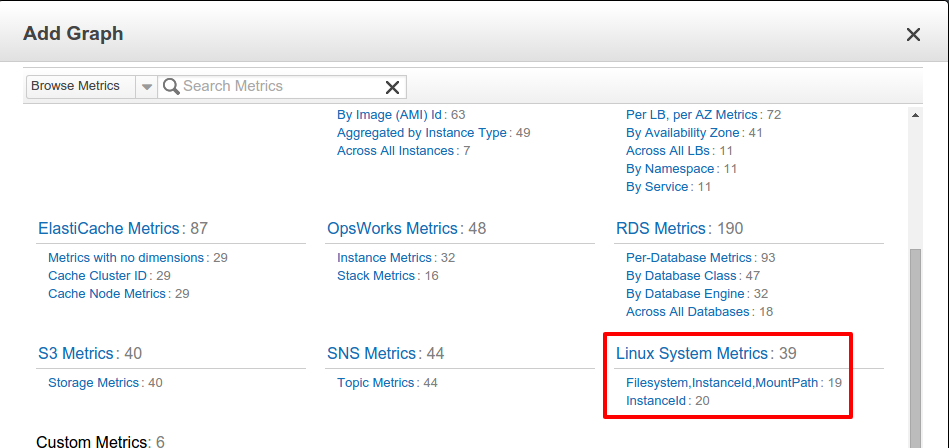
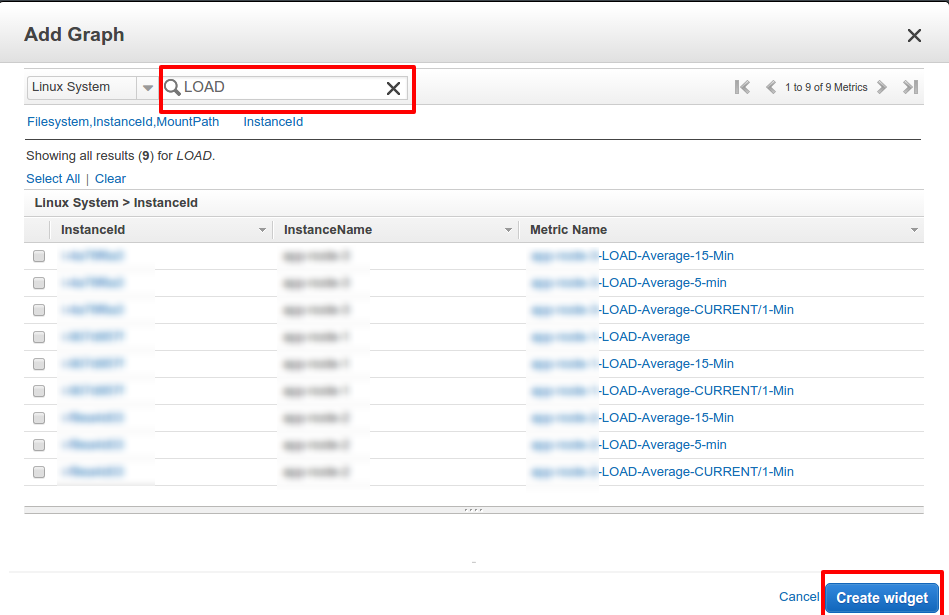
After clicking on Linux System Metric it will list all the metrics inside that we are interested in load average metrics. I have named these metrics having the keyword “LOAD“. So, in the search bar I will just put in LOAD and press enter. It will filter out all the metrics. You can put in any keyword part of the name in the search to filter if you have a lot of metrics in a particular namespace. Check all the checkboxes in front of the metric whichever you want. After this, we click on Create widget:
3. It will create a widget in the Dashboard page:
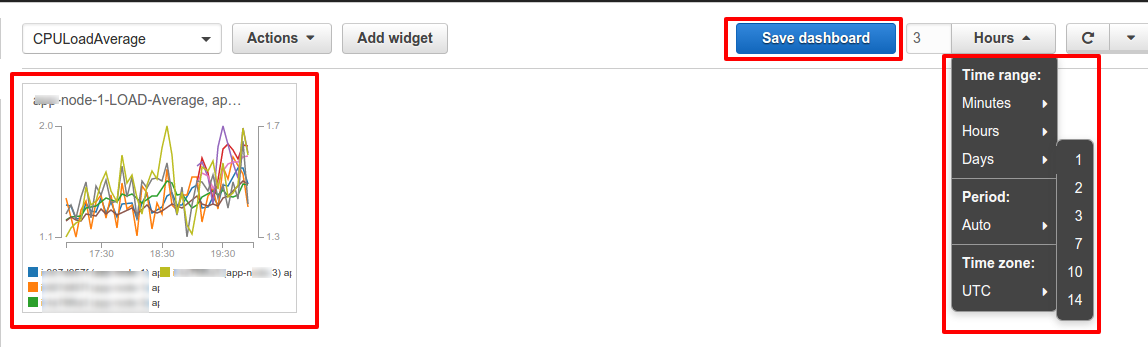
On the left side is the widget containing all the metrics together. On the right, you have an option of choosing the time range for the metrics data inside the widget. Change it according to your use-case. Next, just click on Save dashboard.
4. Let’s explore the widget. After saving the dashboard just click on the metric:
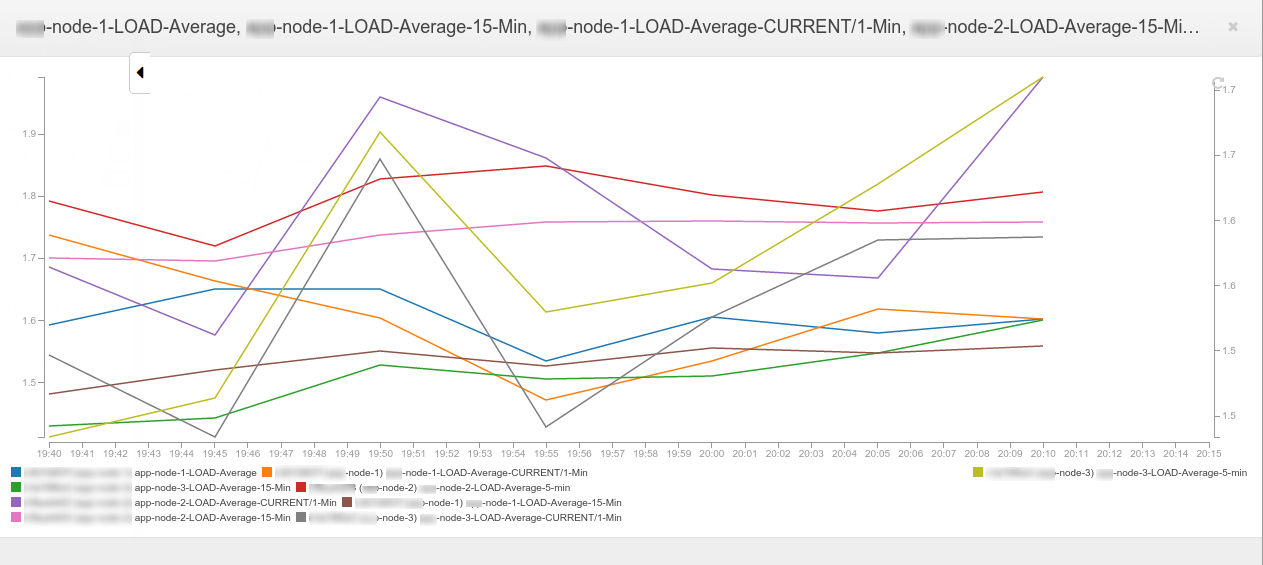
It will have all the metrics of load average that we selected at one place making it simpler and easier to monitor them. Metrics will be differentiated with different colours and colours are described just under the graph.
In my next blog, we will discuss some more use-cases of AWS CloudWatch Dashboard.