
How to Integrate Nagios with PagerDuty
Nagios is an open-source infrastructure monitoring tool. It monitors your Hosts & Services that are defined and alerts you if any of the hosts or services go down by the different alert mechanism like email, SMS, etc.
PagerDuty is an enterprise incident resolution service that gives you an alert on email, SMS & call. By integrating PagerDuty with Nagios you can get an alert on call and can resolve or escalate it to the next level from the call directly.

![]()
Steps to integrate PagerDuty with Nagios:
1. Create a new service or edit existing service in your PagerDuty account.
2. Add an Integration policy and select Nagios as an Integration Type.
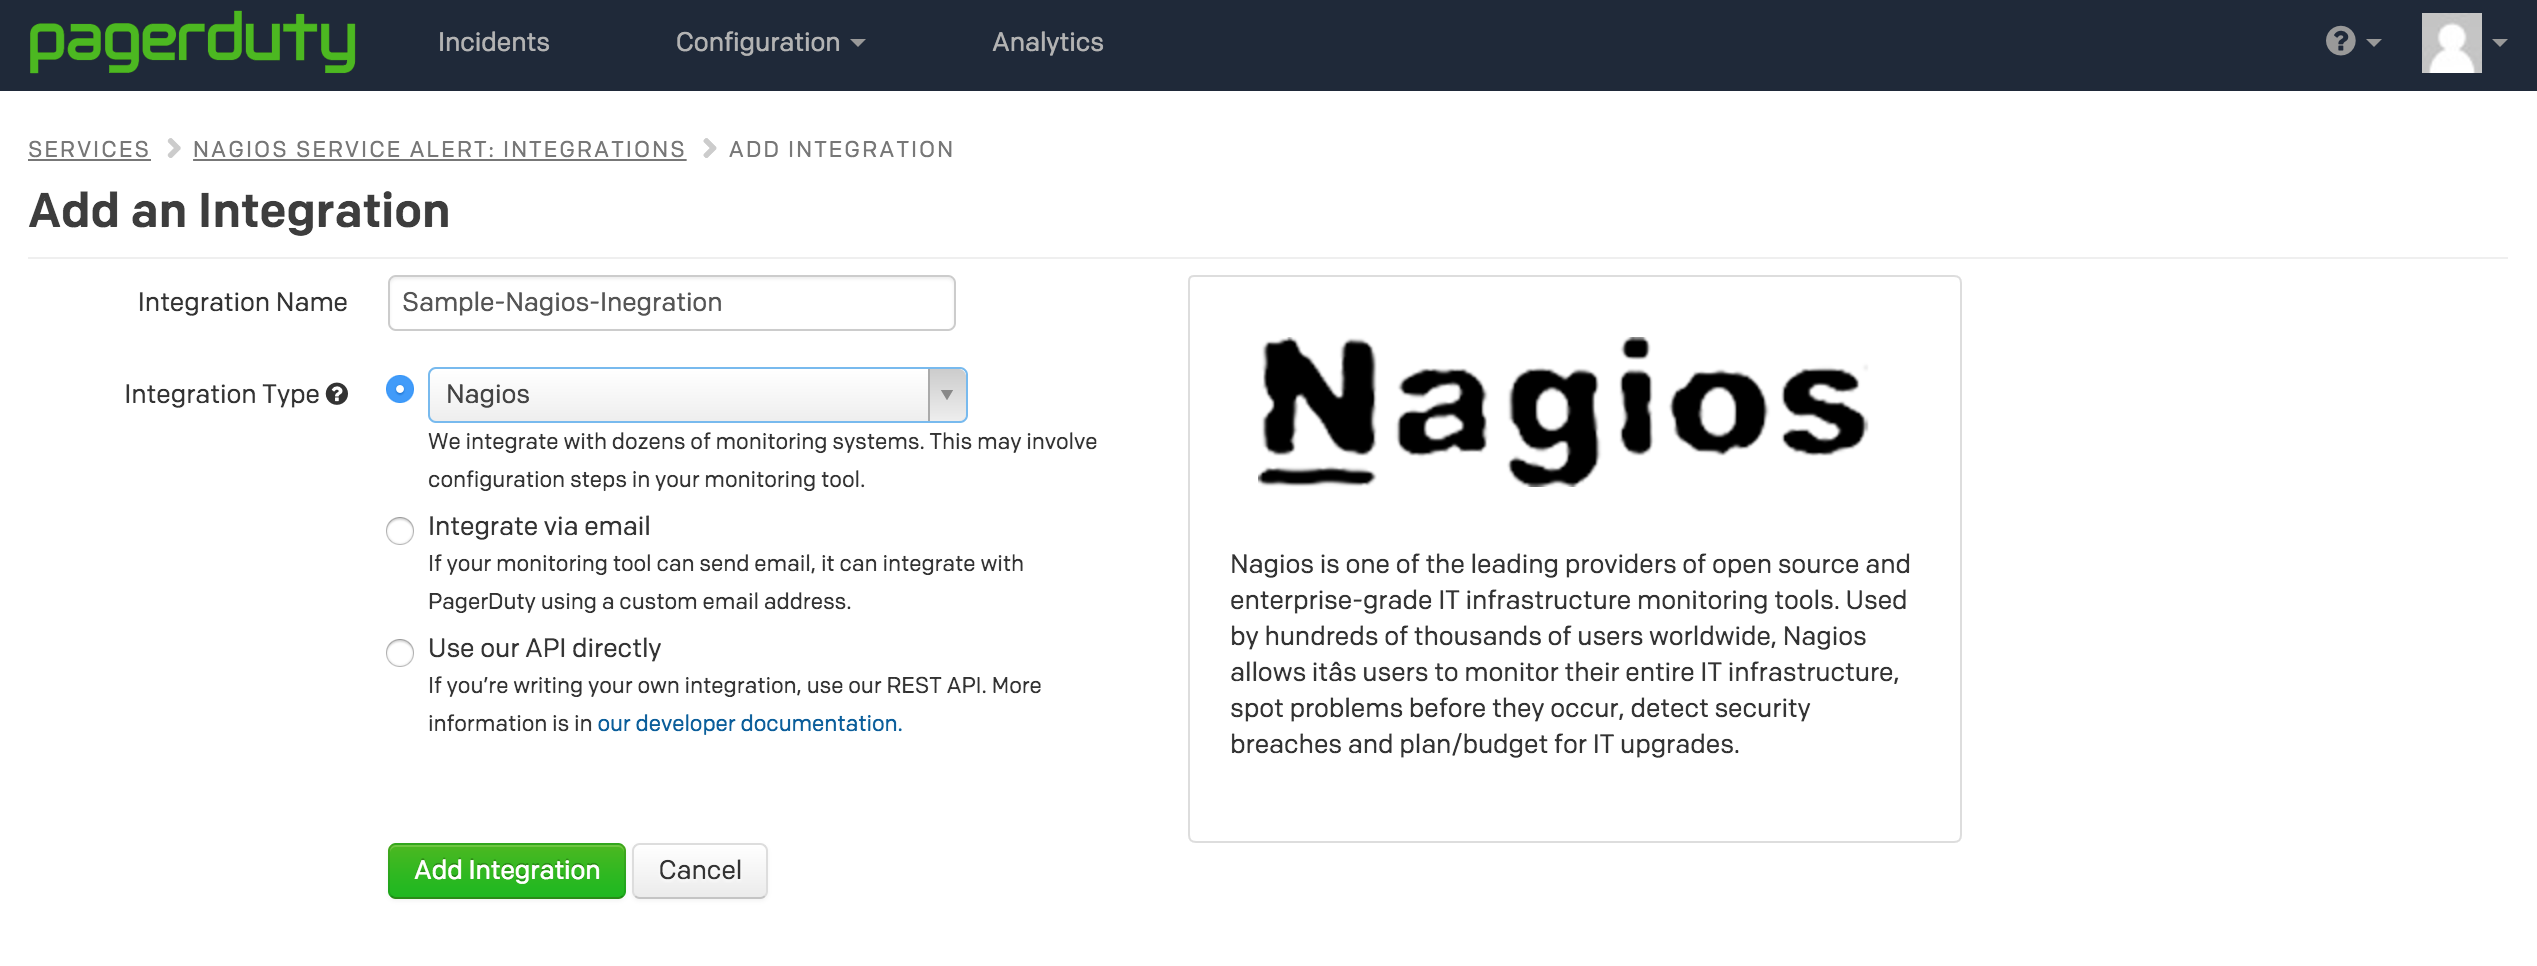
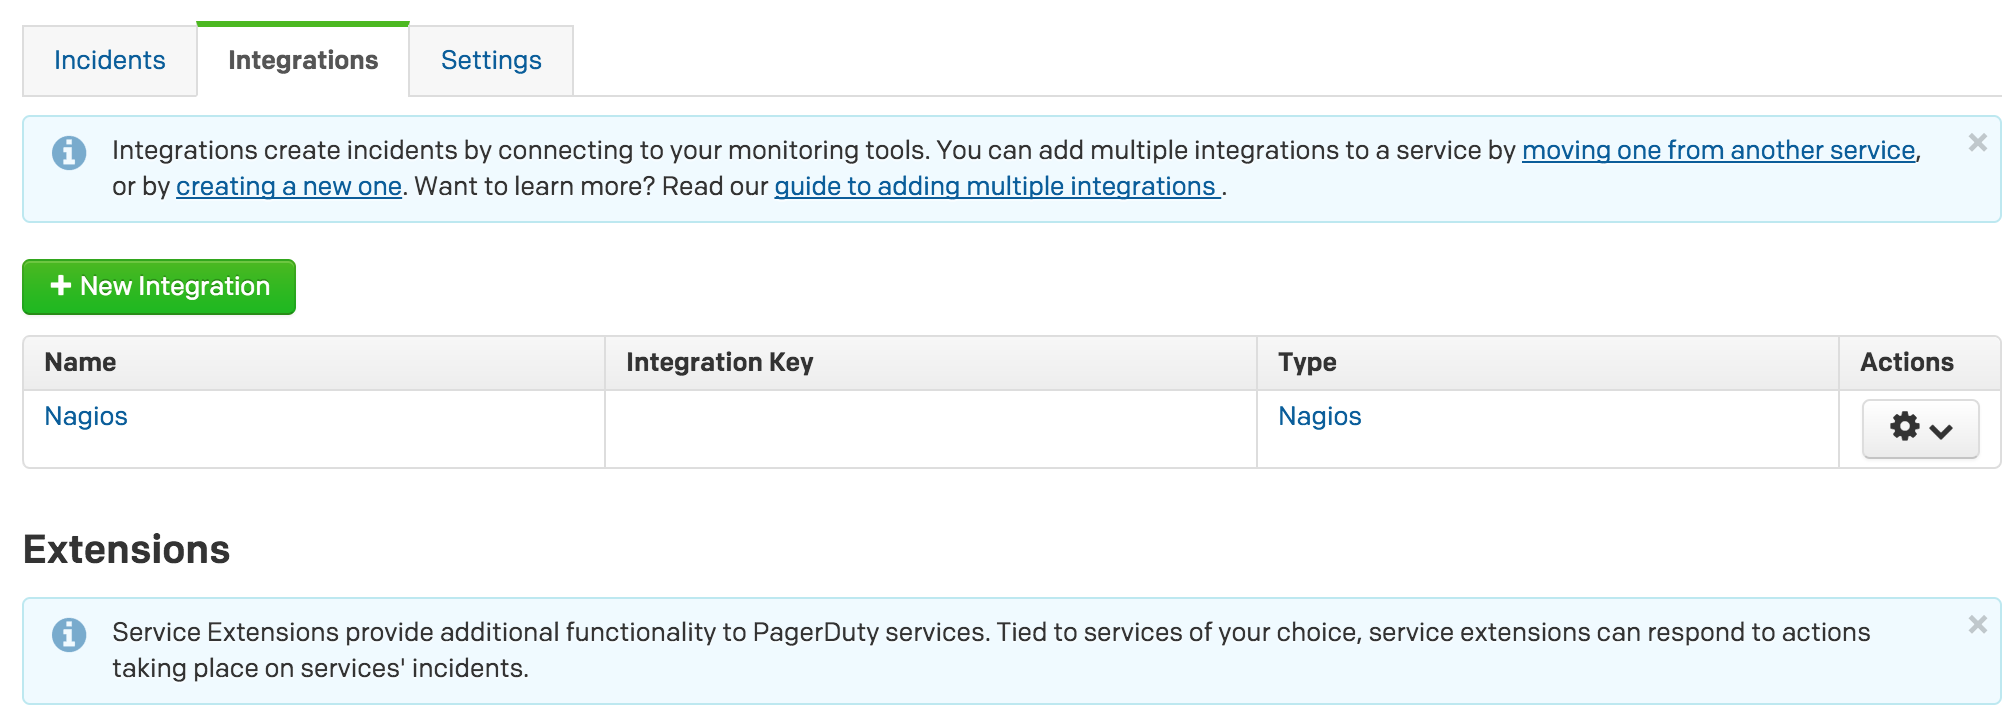
3. Copy your integration key to configure alerts in Nagios server.
4. Install PagerDuty on your Nagios Server:
[code]
wget -O – https://packages.pagerduty.com/GPG-KEY-pagerduty | sudo apt-key add –
sudo sh -c ‘echo "deb deb/" > /etc/apt/sources.list.d/pdagent.list’
sudo apt-get update
sudo apt-get install pdagent pdagent-integrations
[/code]
5. Create a new contact group on your Nagios server and add the code below. Enter your PagerDuty integration key that you copied in step 3, at the place of PAGERDUTY-SERVICE-KEY.
[code]
define contact {
contact_name pagerduty
alias PagerDuty
Contact service_notification_period 24×7
host_notification_period 24×7
service_notification_options w,u,c,r
host_notification_options d,r
service_notification_commands notify-service-by-pagerduty
host_notification_commands notify-host-by-pagerduty
pager PAGERDUTY-SERVICE-KEY
}[/code]
6. Create a new command file or edit the existing command file and add the below code to it. If you are not creating a new command file in your Nagios config directory, you need to add the complete path of your command file in the Nagios main config file and restart the Nagios service.
[code]define command {
command_name notify-service-by-pagerduty
command_line /usr/share/pdagent-integrations/bin/pd-nagios -n service -k $CONTACTPAGER$ -t "$NOTIFICATIONTYPE$" -f SERVICEDESC="$SERVICEDESC$" -f SERVICESTATE="$SERVICESTATE$" -f HOSTNAME="$HOSTNAME$" -f HOSTDISPLAYNAME="$HOSTDISPLAYNAME$" -f SERVICEDISPLAYNAME="$SERVICEDISPLAYNAME$" -f SERVICEPROBLEMID="$SERVICEPROBLEMID$" -f SERVICEOUTPUT="$SERVICEOUTPUT$"
}
define command {
command_name notify-host-by-pagerduty
command_line /usr/share/pdagent-integrations/bin/pd-nagios -n host -k $CONTACTPAGER$ -t "$NOTIFICATIONTYPE$" -f HOSTNAME="$HOSTNAME$" -f HOSTSTATE="$HOSTSTATE$" -f HOSTDISPLAYNAME="$HOSTDISPLAYNAME$" -f HOSTPROBLEMID="$HOSTPROBLEMID$"
}[/code]
7. Add ‘Pagerduty’ user which you have created in step 5, in the main contact group that you are using to send alerts. By default Nagios uses ‘/etc/nagios3/conf.d/contacts_nagios2.cfg’ file and uses the admin contact group.
[code]define contactgroup{
contactgroup_name admins
alias Nagios Administrators
members root,pagerduty // Adding PagerDuty User
}[/code]
8. Restart your Nagios service and you will start getting alerts if any host or service goes down.
TroubleShooting:
1. You can check your PagerDuty Agent status running on your Nagios server and stop/start/restart it too.
[code]sudo service pdagent status // Check Agent Status
sudo service pdagent restart // Restart Agent[/code]
2. Send events manually on PagerDuty to check your integration key.
[code]pd-send -k PD_SERVICE_KEY -t trigger -d "Service Description"
pd-send –help // for more help[/code]
3. Check your Agent queue status by using below command.
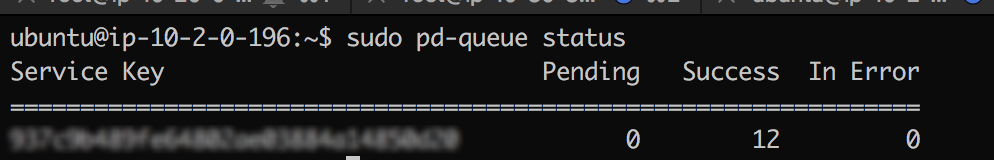
If you have configured multiple keys on your Nagios server, it will show you multiple entries against each key.
4. To send error events again you can use retry command as below.
[js]pd-queue retry -k YOUR-PAGERDUTY-KEY // retry givens key’s alert
pd-queue retry -a // retry all keys’ alert[/js]
By following the above steps, you can use both the services as per your use case. Here is another blog giving some useful configuration tips for configuring Nagios monitoring system.


You should check out ngDesk instead as its totally free and has more features then pager duty.