
How to set up Blackbox exporter to monitor websites with Prometheus
Introduction
It is very crucial for the website to be up and running all time without any failure. Prometheus provides a feature of Blackbox Exporter that probe the endpoints using HTTP, TCP, DNS, HTTPS and ICMP protocols. If the exporter is setup with the Prometheus, you can scrape the services and see if they are up and running and can also set up alerts, or check the service health to avoid downtime.
So, in this blog we will see how to deploy and configure the blackbox exporter onto a linux server. Also we will be configuring it with Prometheus to monitor the availability of website and create alerts.

Prerequisites
- A Linux Server with sudo level access (Monitoring Server)
- Server size will be depending on the load of monitoring.
- Prometheus installed and running on Monitoring server
- Grafana installed and running on Monitoring server
- Basic linux command and networking understanding
Step 1 – Installing Blackbox Exporter
Firstly, let see how to deploy and expose Blackbox Exporter.
1.1 Add a User for Blackbox Exporter
For best execution, Blackbox Exporter should run on a special system user and it should be separated from the others:

1.2 Download the Exporter
Now, download Latest version of Blackbox Exporter from the official GitHub releases using the command:
wget https://github.com/prometheus/blackbox_exporter/releases/latest/download/blackbox_exporter-linux-amd64.tar.gz
Unpack the archive using this command :
tar -xvf blackbox_exporter-linux-amd64.tar.gz
1.3 Move the extracted files
Move the binary to a bin:
mv blackbox_exporter-linux-amd64/blackbox_exporter /usr/local/bin/
Change owner to the Blackbox Exporter user that we had created previously :
chown blackbox_exporter:blackbox_exporter /usr/local/bin/blackbox_exporter
Remove leftover files:
rm -rf blackbox_exporter-linux-amd64
Step 2: Configure
2.1 Set Up the Configuration File
Create a configuration folder :
mkdir /etc/blackbox_exporter
Now, create a configuration file:
nano /etc/blackbox_exporter/blackbox.yml
2.2 Basic Module Configuration
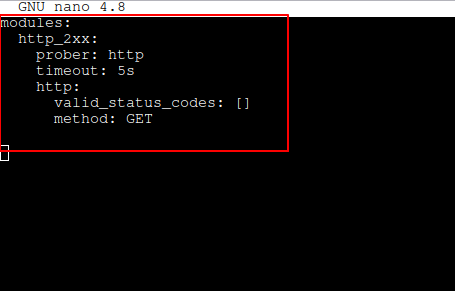
Execute the following command to modify the file ownership:
chown blackbox_exporter:blackbox_exporter /etc/blackbox_exporter/blackbox.yml
Step 3: Configure a systemd Service
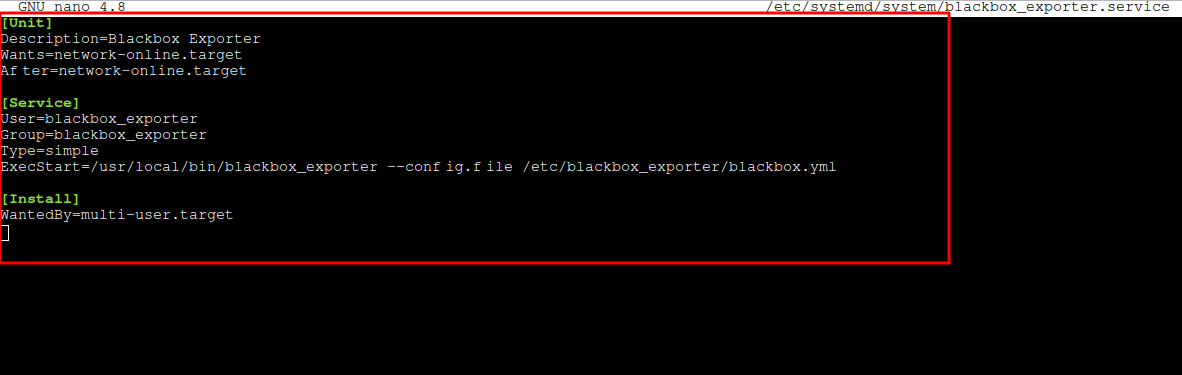
3.1 Create the Service File
Create a systemd service file :
nano /etc/systemd/system/blackbox_exporter.service
Paste the below config to the newly created service file :
3.2 Start and Enable Service
sudo systemctl daemon-reload
systemctl start blackbox_exporter
Reload systemd and start the service:
systemctl daemon-reload
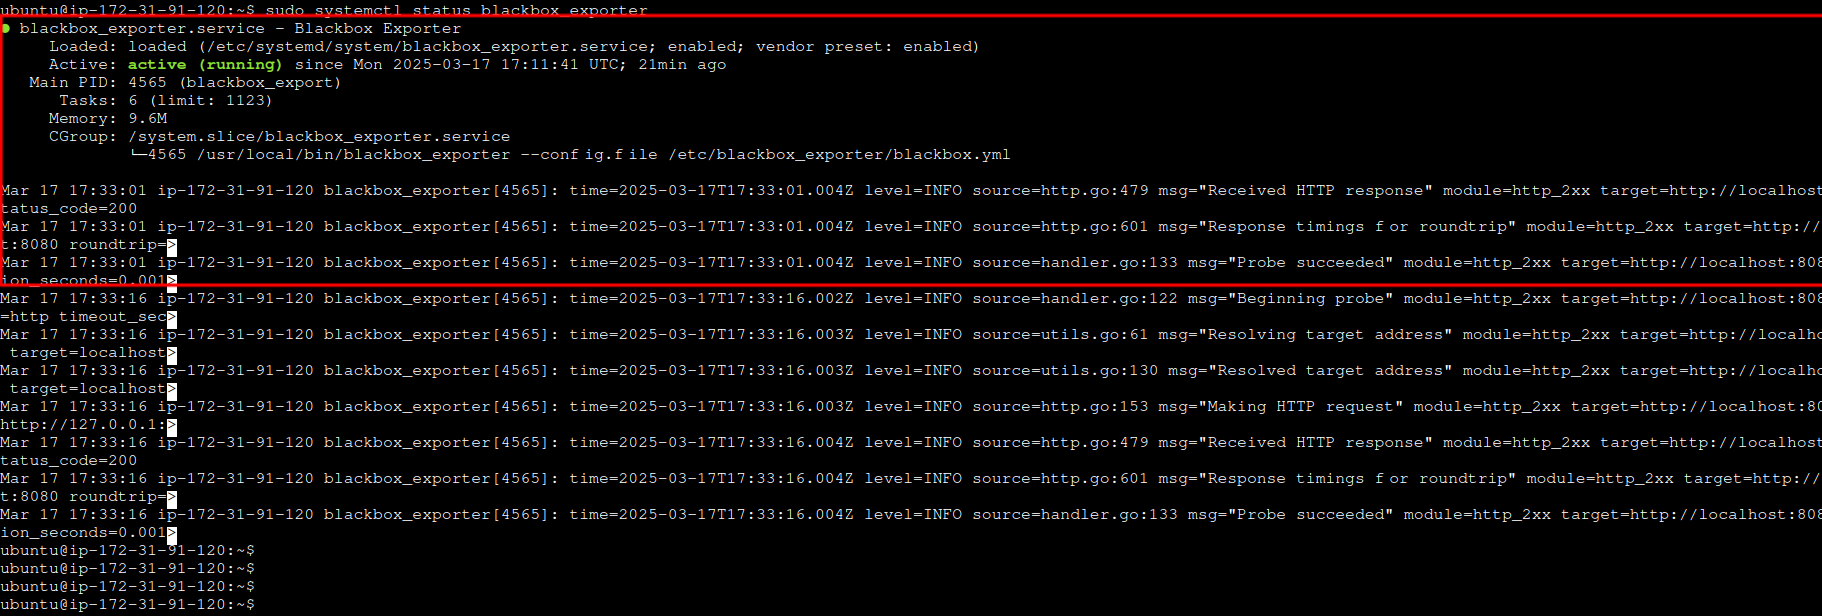
Check the status of service :
systemctl status blackbox_exporter
Enable the service to start at boot:
systemctl enable blackbox_exporter
Step 4: Integrating with Prometheus
4.1 Modifying the Prometheus Configuration
Open the Prometheus configuration file :
nano /etc/prometheus/prometheus.yml
4.2 Add the below scrape job:
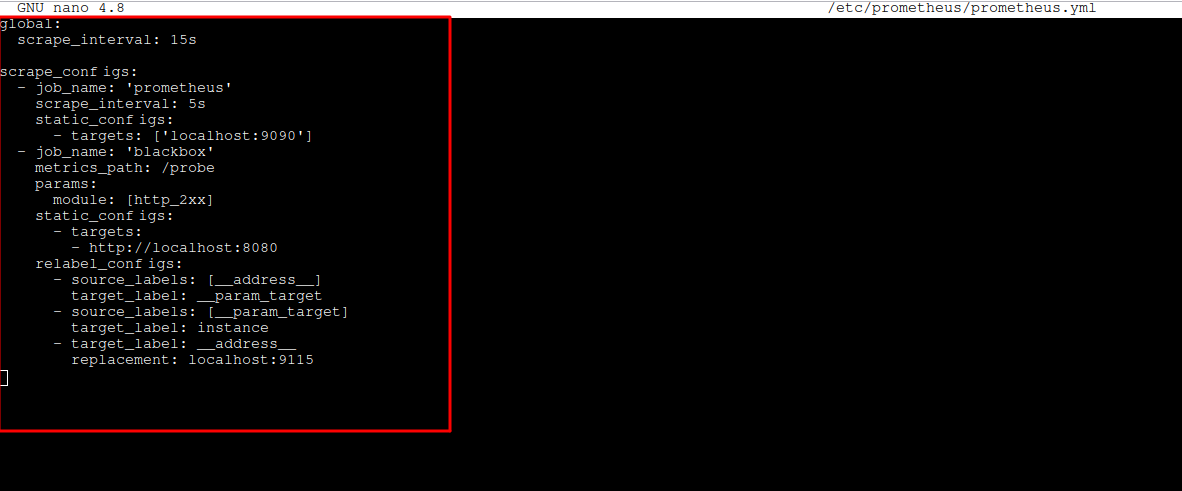
Save the file and restart the prometheus service :
systemctl restart prometheus
Step 5: Configuring Grafana
5.1 Adding Prometheus as a Data Source
If you want to see the Blackbox Exporter metrics within Grafana, you can follow these steps to achieve that:
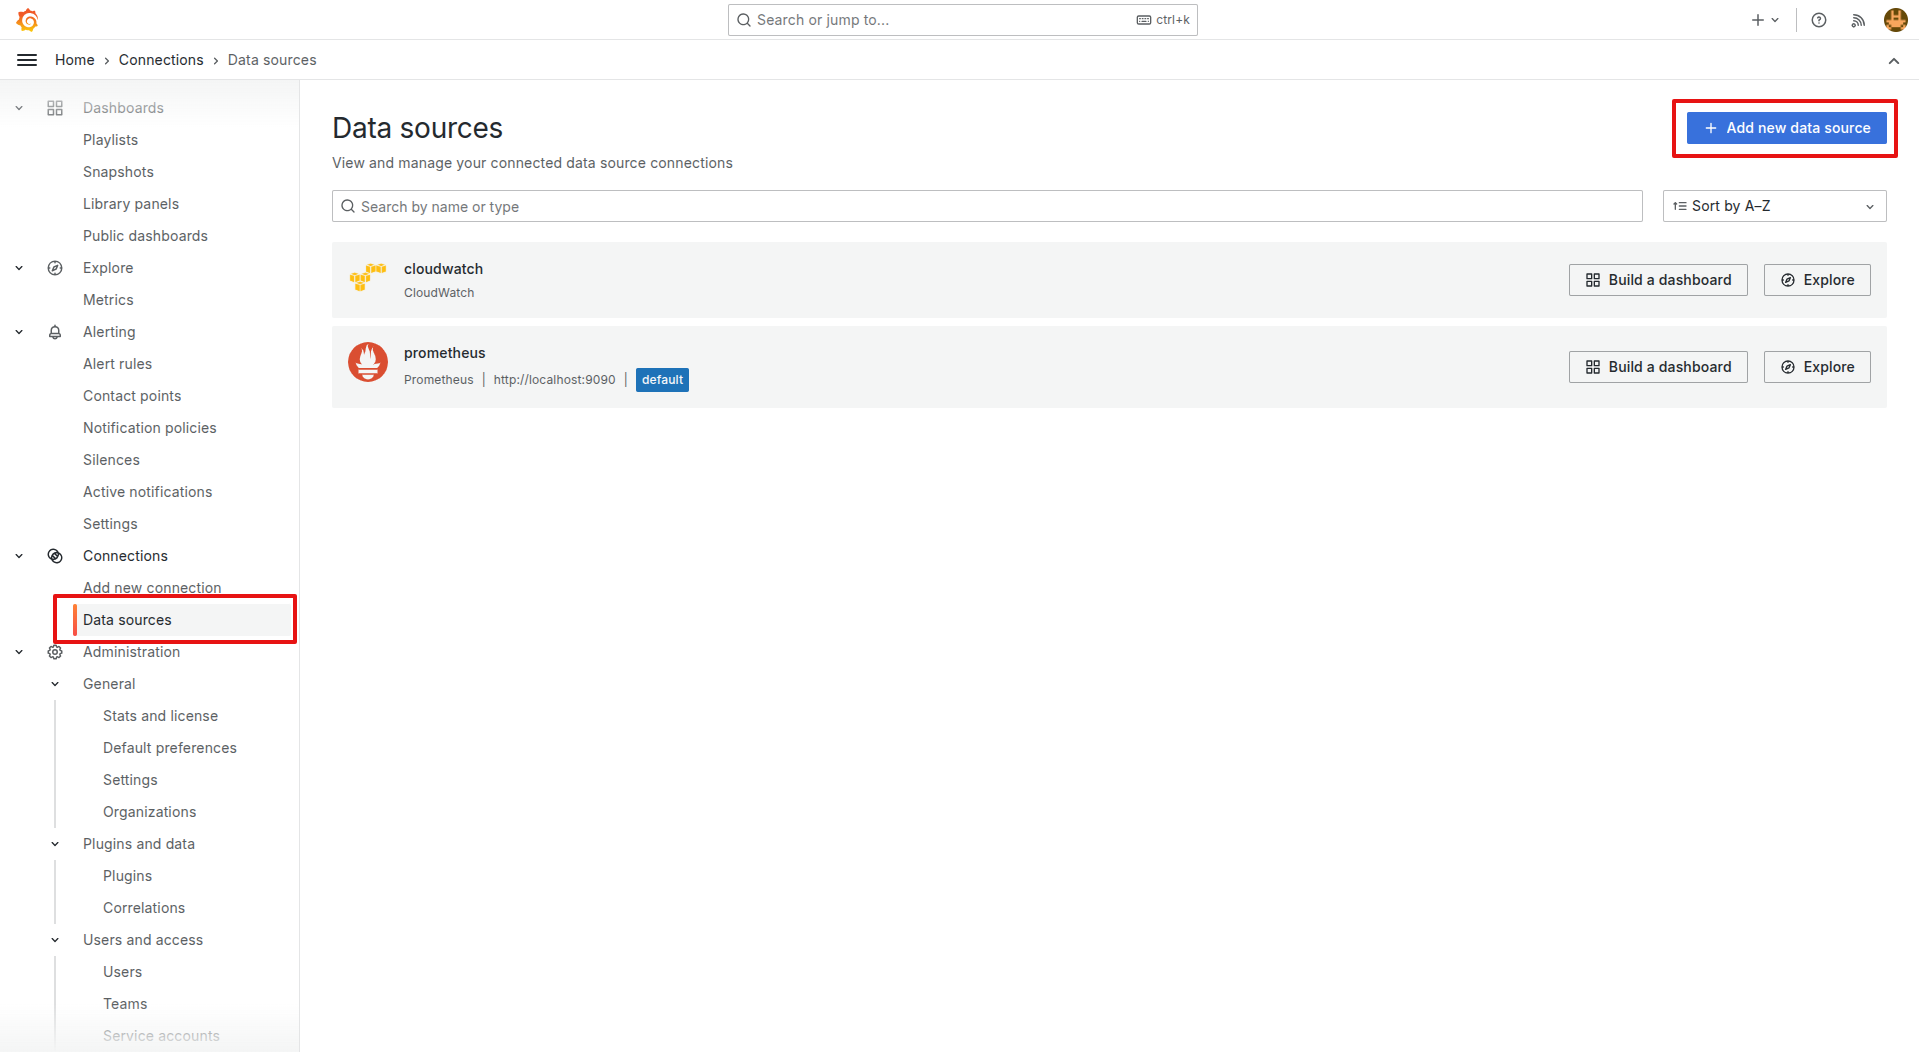
- Click on grafana, go to data sources now you will see “+ Add new data source” click on that and choose Prometheus
.
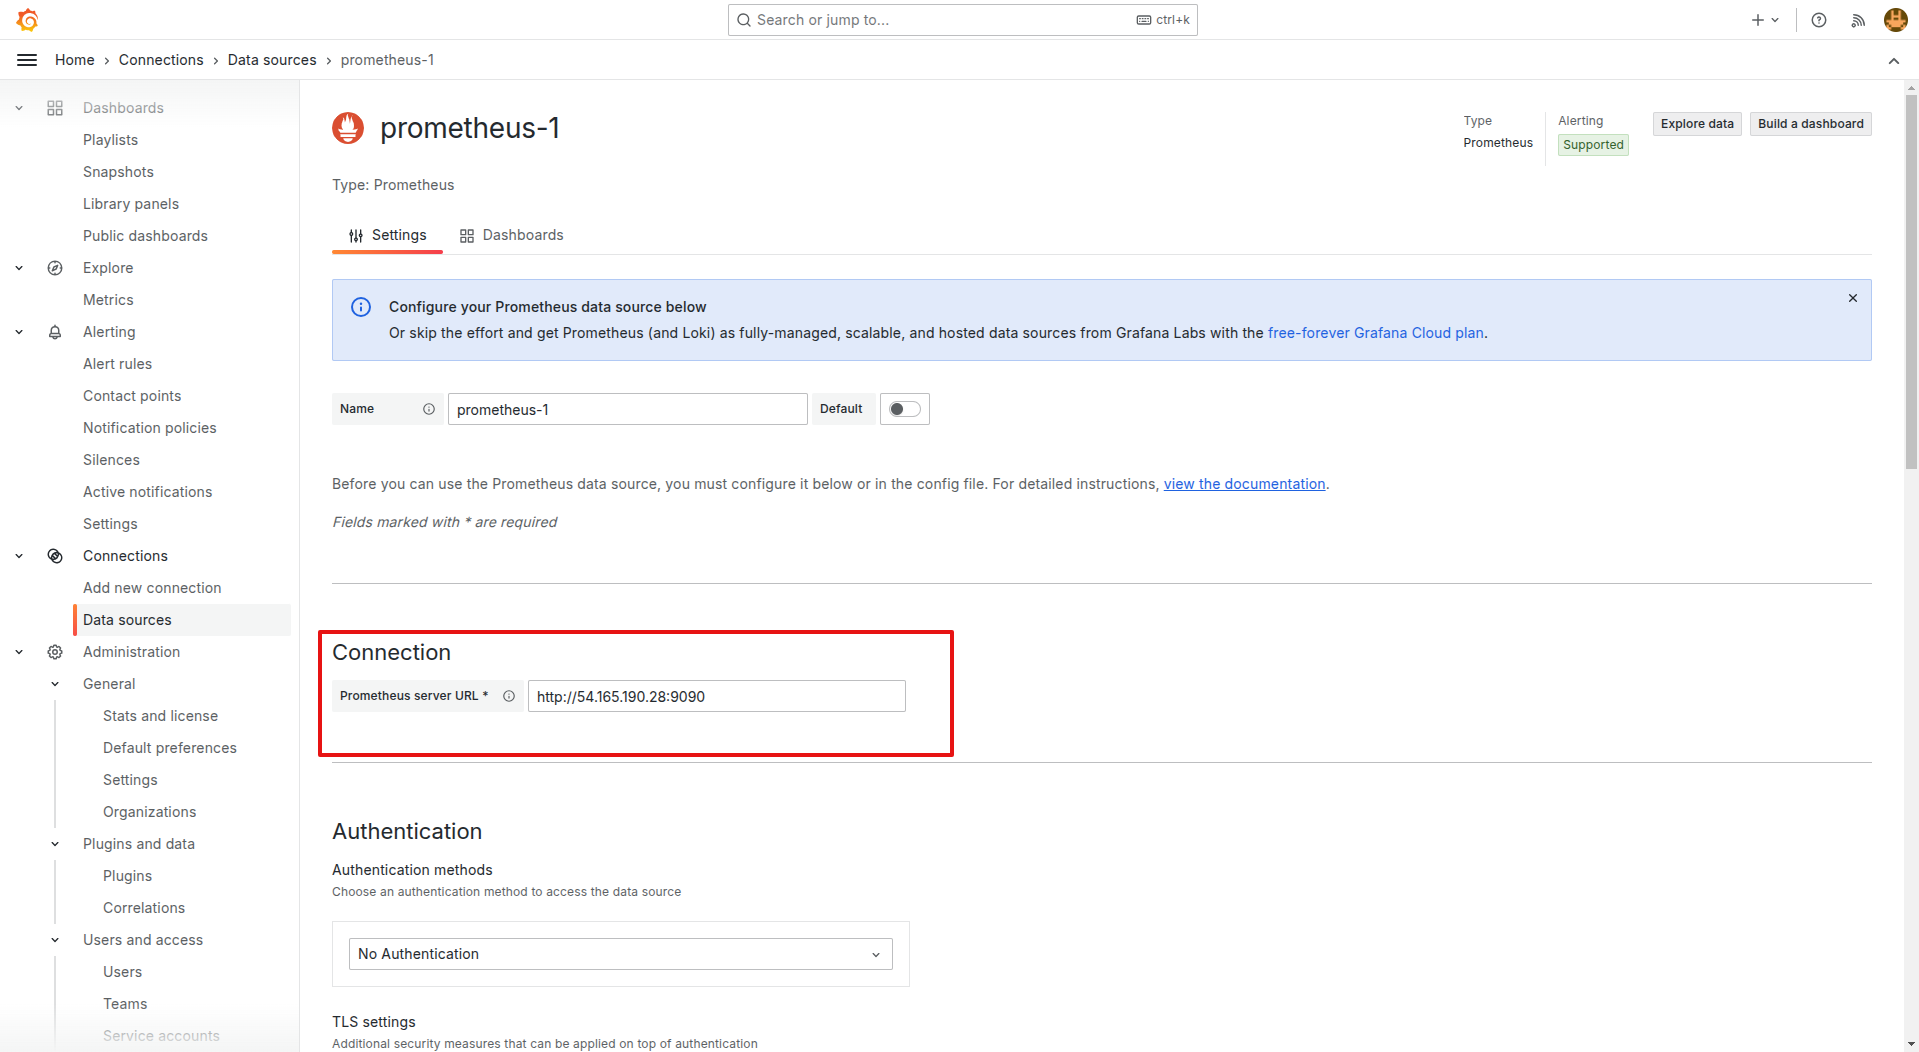
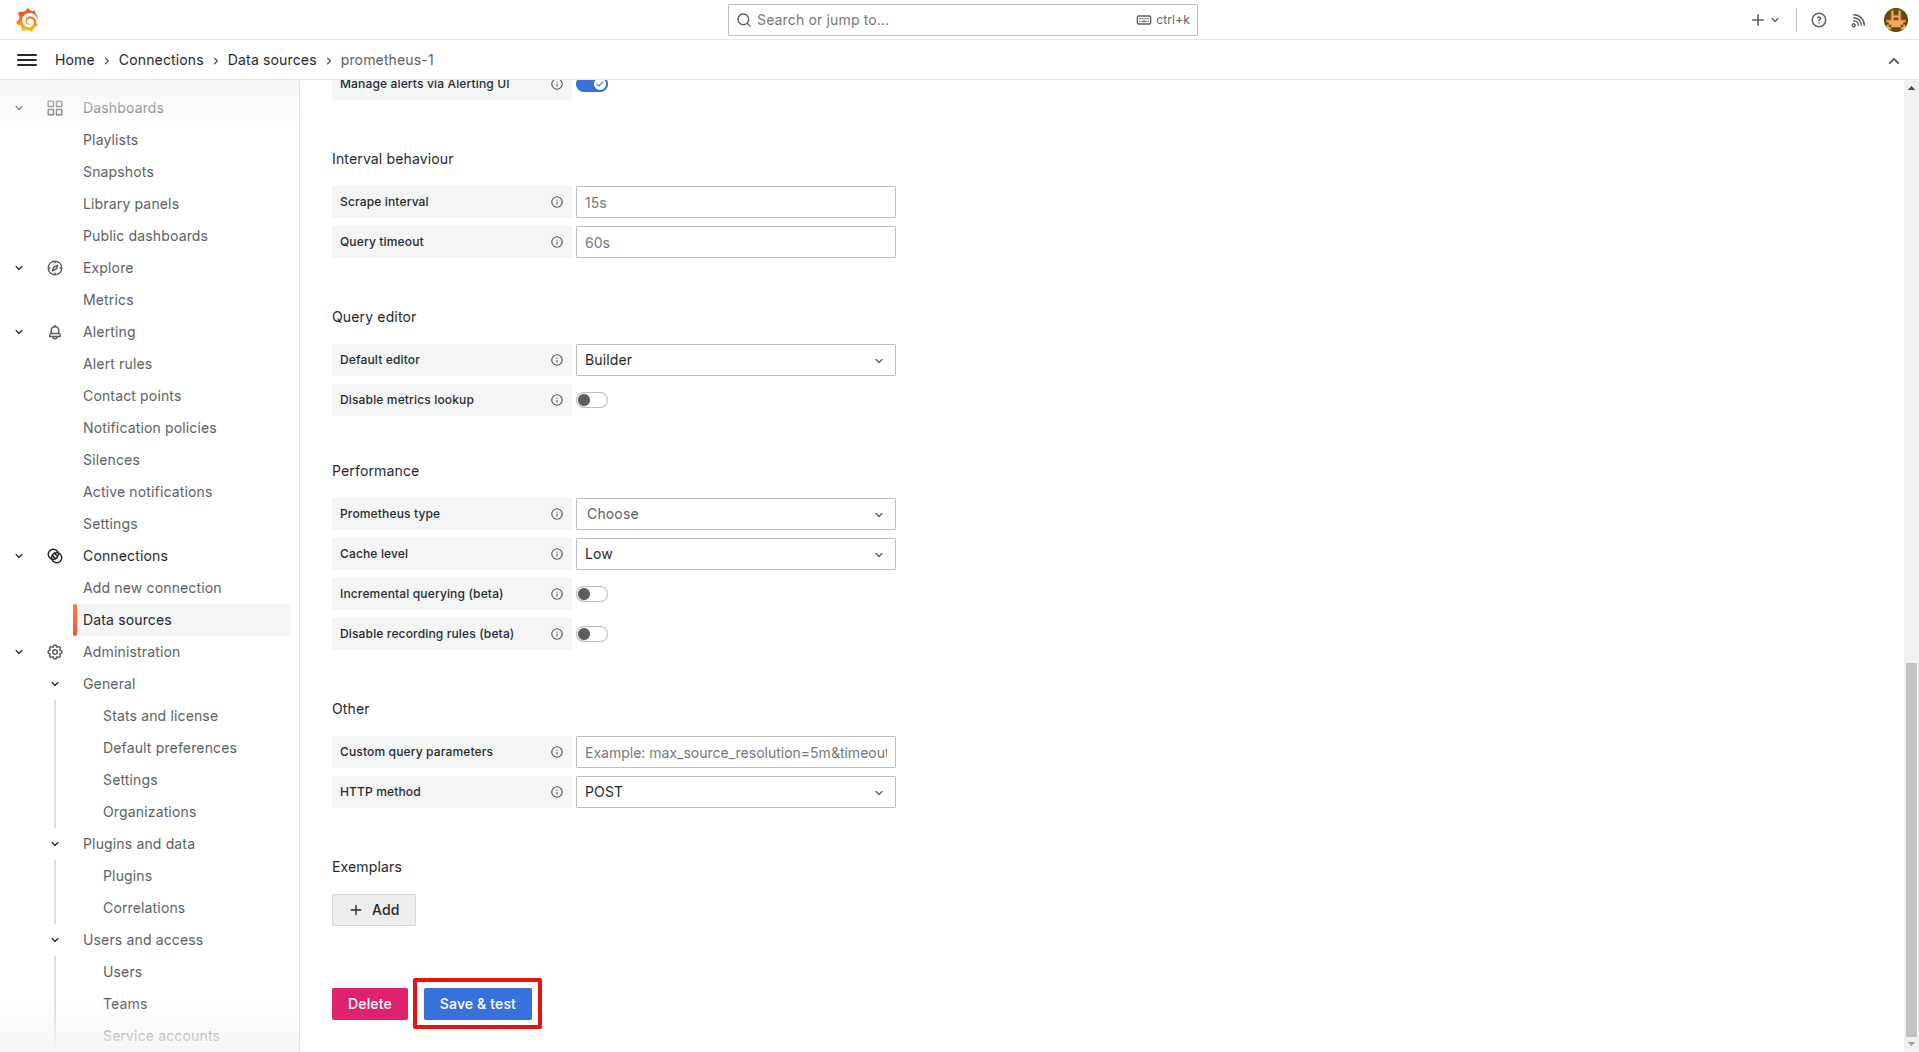
- now in this step, paste your Prometheus server URL and then click on save & test.
5.2 Create a Custom Dashboard
Grafana provides pre-built dashboards but we can also create a custom dashboard.
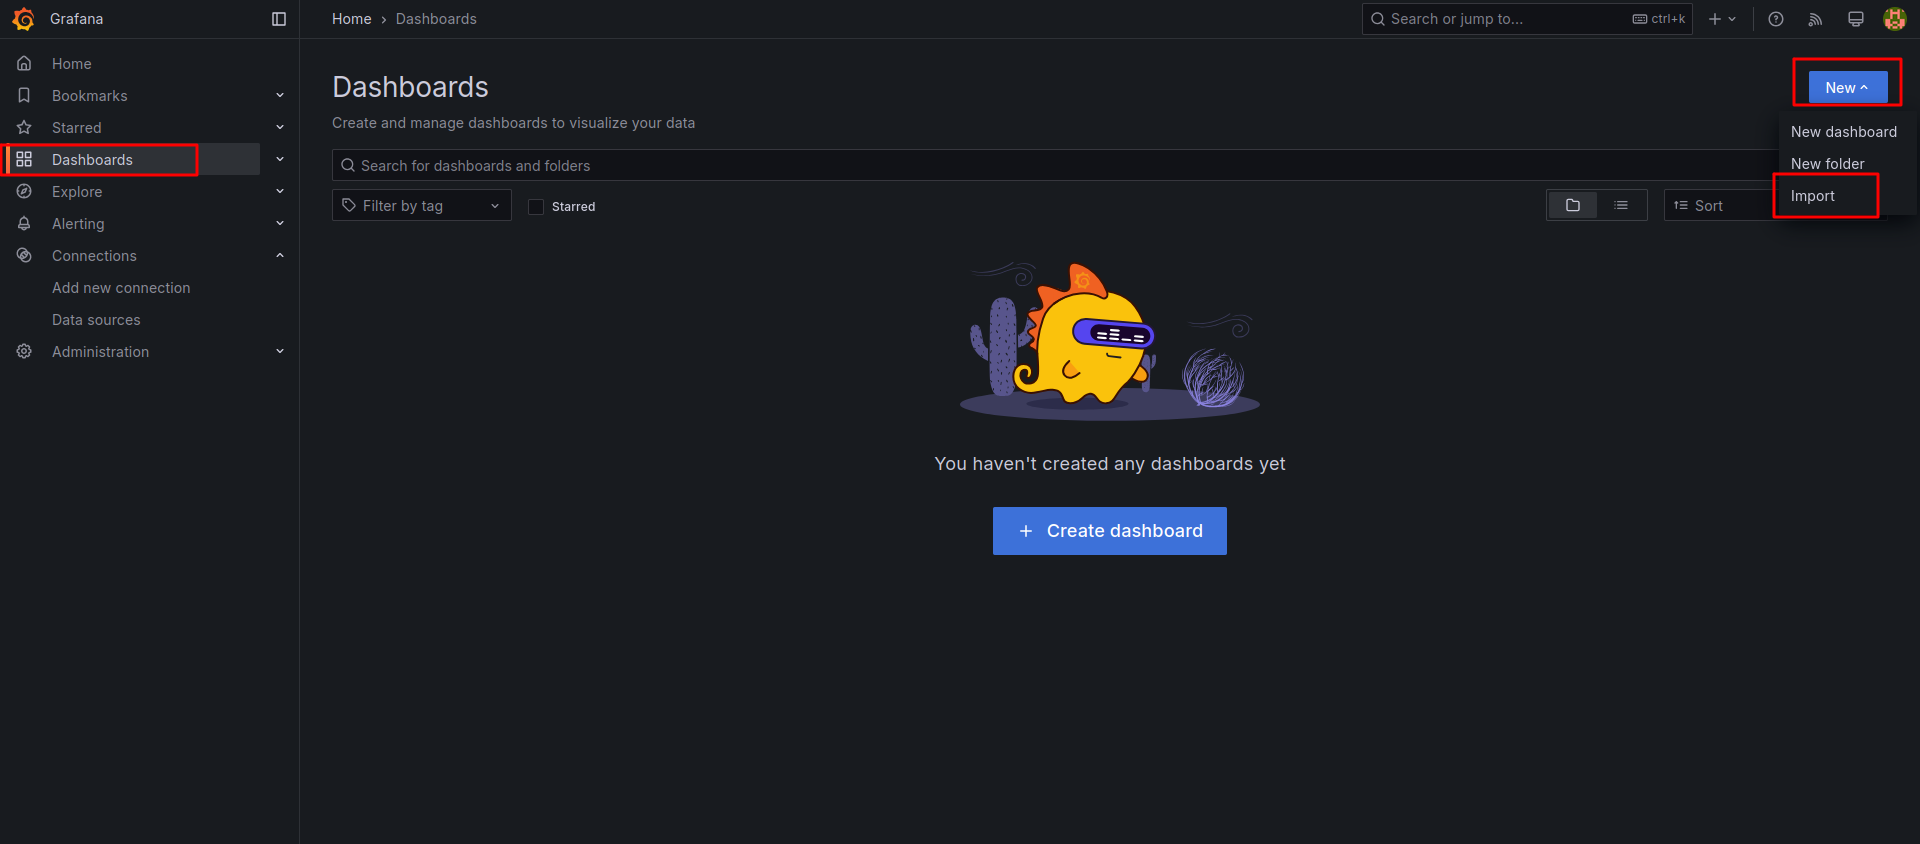
- Go to Dashboards, and then click on New and then click on Import.
- Import the pre built Prometheus Blackbox Exporter dashboard, This dashboard will use metrics from blackbox exporter to show the data.
- Save the dashboard.

Conclusion
With the help of above steps, you can easily deploy and configure Blackbox Exporter, and run it with Prometheus. This will allow you to check the availability and status of web services, get notified in case of failure, and fix the issue before the performance is affected.
