
In Cloud’s Chronology, Kubernetes is most widely used container orchestrator to deploy microservices. In its ecosystem, maintenance is quite challenging. Though numerous companies are grappling daily to quantify/monitor cost utilisation for their running clusters because 99.99% uptime or High Availability of clusters is a bit costly.
How to Quantify K8s Usage Cost
If we could know how much we spend cloud resources? Can we bifurcate the usage cost based on different K8s objects, such as services, namespaces, pods, containers, and other groups? Is KUBECOST is answer to those questions?
Introduction
Kubecost is a cost monitoring and management tool which helps us to quantify the K8s usage cost in our cluster. It comes with real-time cost visibility, which allows our teams to track, manage and lower spend. It is available in both edition, Community as well as Enterprise. Enterprise Edition has added features such as report saving, user auth, sso, extended metrics retention, enterprise support.
Kubecost Features
Kubecost Standard Edition provides real-time cost monitoring and valuable information for teams using Kubernetes, which helps us lower or reduce cost by looking at under and over-utilised resources.
- Cost Allocation: Bifurcate Costs based on different Kubernetes objects such as deployment, service, namespace label, and more. Visualize cost usage of multiple clusters in a single plane.
- Unified cost monitoring: Cost Usage of K8s workloads and other clouds can be unified with complete cloud service billing integration.
- Optimisation Insights: Offers dynamic recommendation to lower cloud spend based on workload behaviour patterns.
- Alerts & Governance: Offers highly reliable and high performance application with dynamic alerts; quickly scrap cost threshold overruns and infrastructure outage breach before they would become a problem with real-time notifications.
Kubecost Installation
Steps will walk you through installing Kubecost into your K8s cluster. The Official Kubecost helm chart contains all necessary dependencies to setup kubecost in just few mins.
Before you Begin
- Helm client (v3.0+) installed
> Install Kubecost via Helm-Chart
Below commands will also install Prometheus, Grafana, and kube-state-metrics in the namespace supplied. You can view install config options here.
$ kubectl create namespace kubecost
$ helm repo add kubecost https://kubecost.github.io/cost–analyzer/
$ helm install kubecost kubecost/cost–analyzer –namespace kubecost –set kubecostToken=”<TYPE API-TOKEN>”
Ensure all the Pods are up and running in kubecost namespace:
$ kubectl get pods –n kubecost
NAME READY STATUS RESTARTS AGE
kubecost–cost–analyzer-7d79c58cbf–tgc6x 2/2 Running 4 (47h ago) 11d
kubecost–grafana-5dff8c6847–vzv6k 2/2 Running 2 (47h ago) 11d
kubecost–kube–state–metrics–f7896dcdd–wgw62 1/1 Running 2 (47h ago) 11d
kubecost–prometheus–node–exporter-89j9x 1/1 Running 2 (47h ago) 11d
kubecost–prometheus–server-77bd8b8d6f–thw9x 2/2 Running 4 (47h ago) 11d
$ kubectl port–forward –namespace kubecost deployment/kubecost-cost-analyzer 9090
For Installation Issues, Please refer
You can now access Kubecost UI at your browser by point. http://<ip_address>:9090.
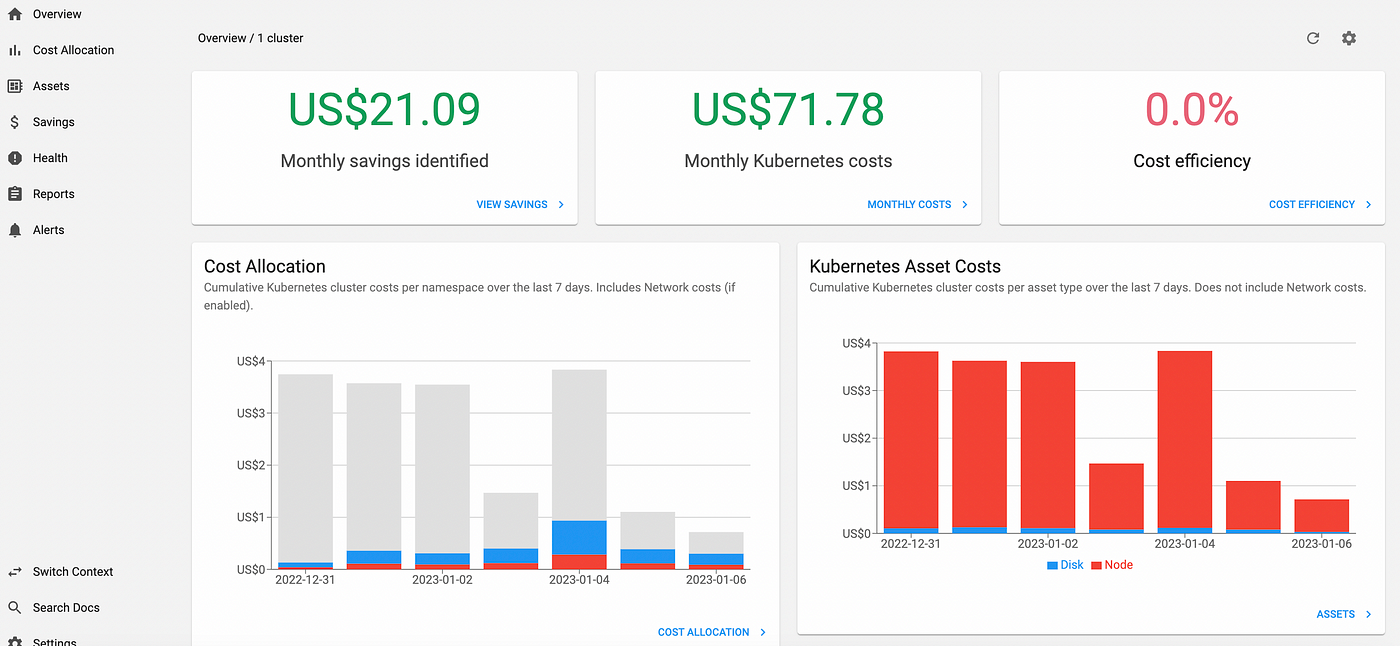
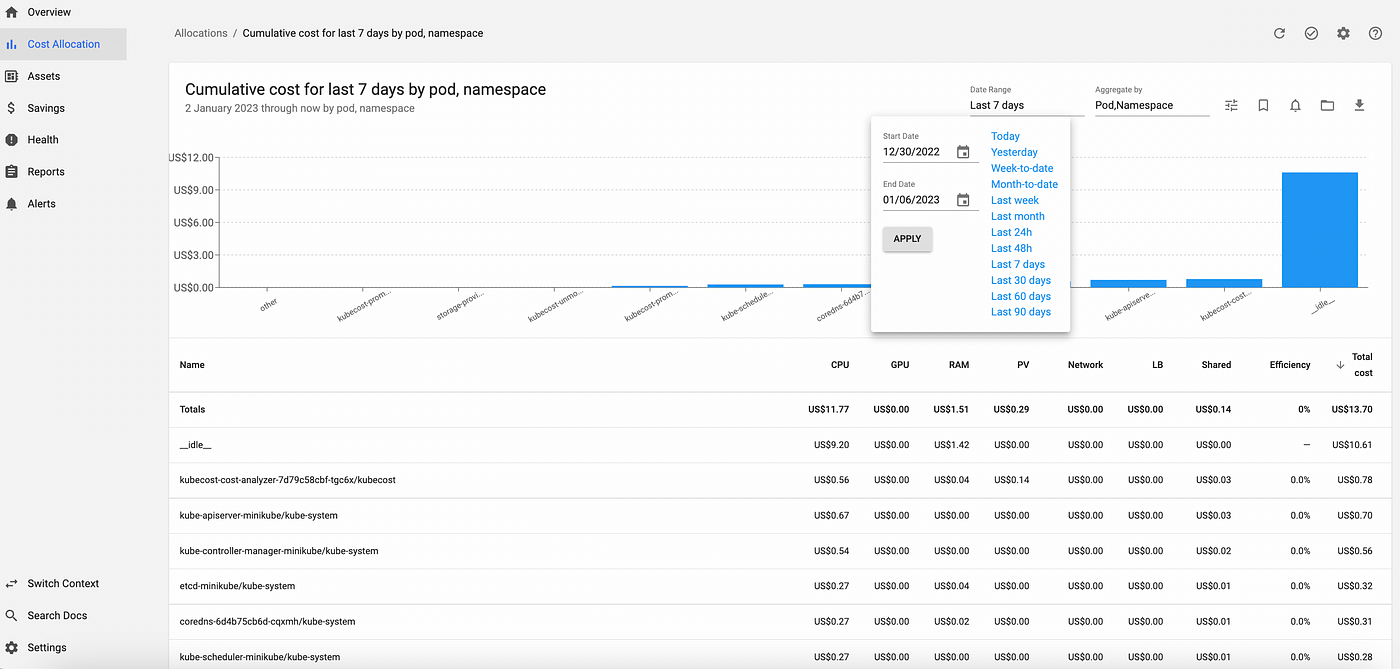
You can navigate to Kubecost UI to view cost usage allocations, Assests, Saving Insights, Generate Report and more. Below are few Sample Cost Usages Overviews
Allocations:
You can select “Allocations” from left pane of Kubecost UI which will show us Cost Utilization on the basis aggregated namespace,container,deployment,pod,service etc. along with “Date Range” to filter out utilization in given time range.
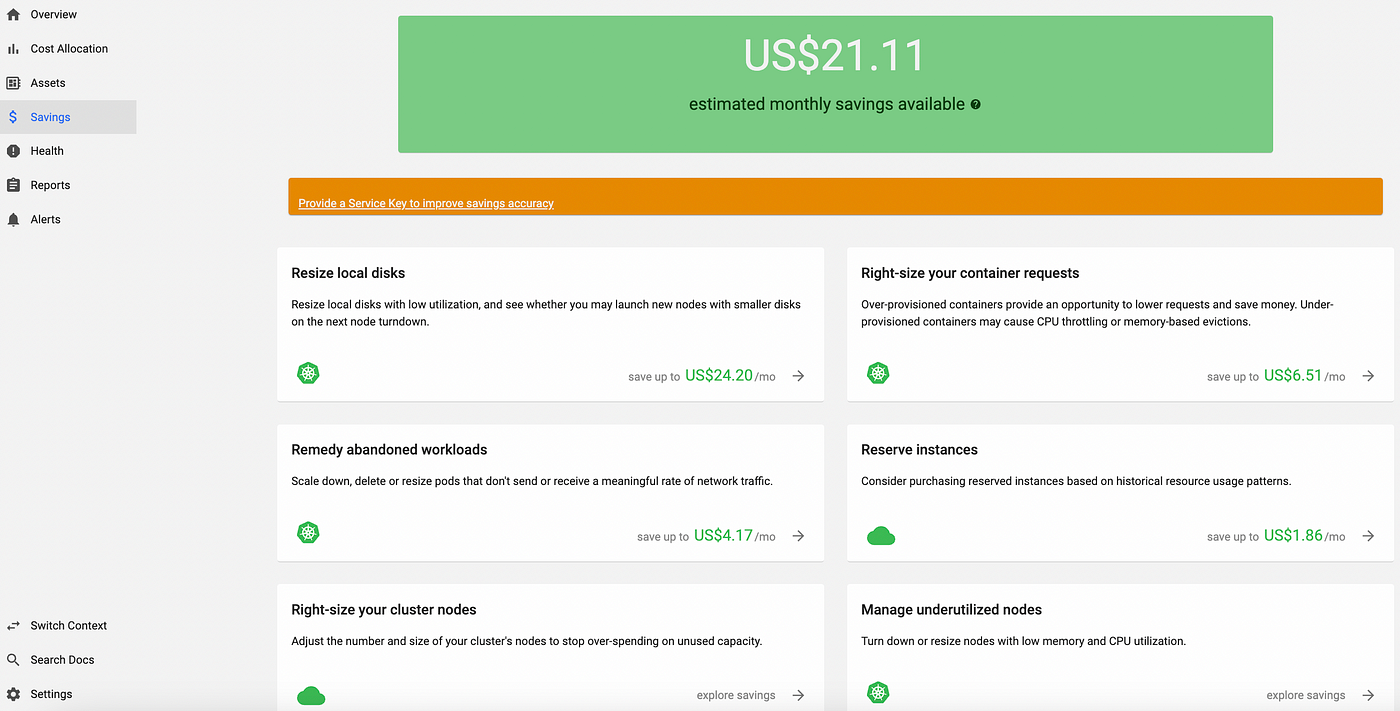
Savings:
You can select “Savings” from left pane of Kubecost UI to check under-utilised resources to reduce cost. It provides insights of over-utilised and underutilized resources(nodes,pods,volume etc).
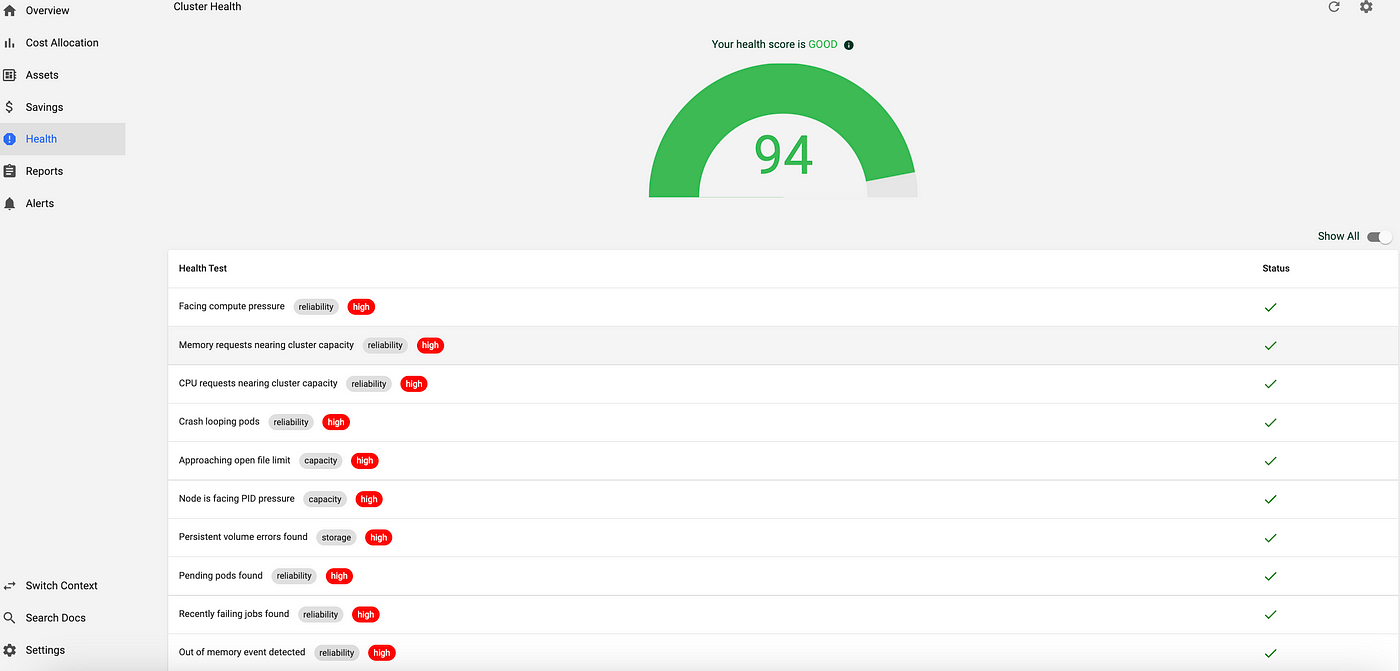
Health:
You can select “Health” from Kubecost UI to check Cluster Health Status
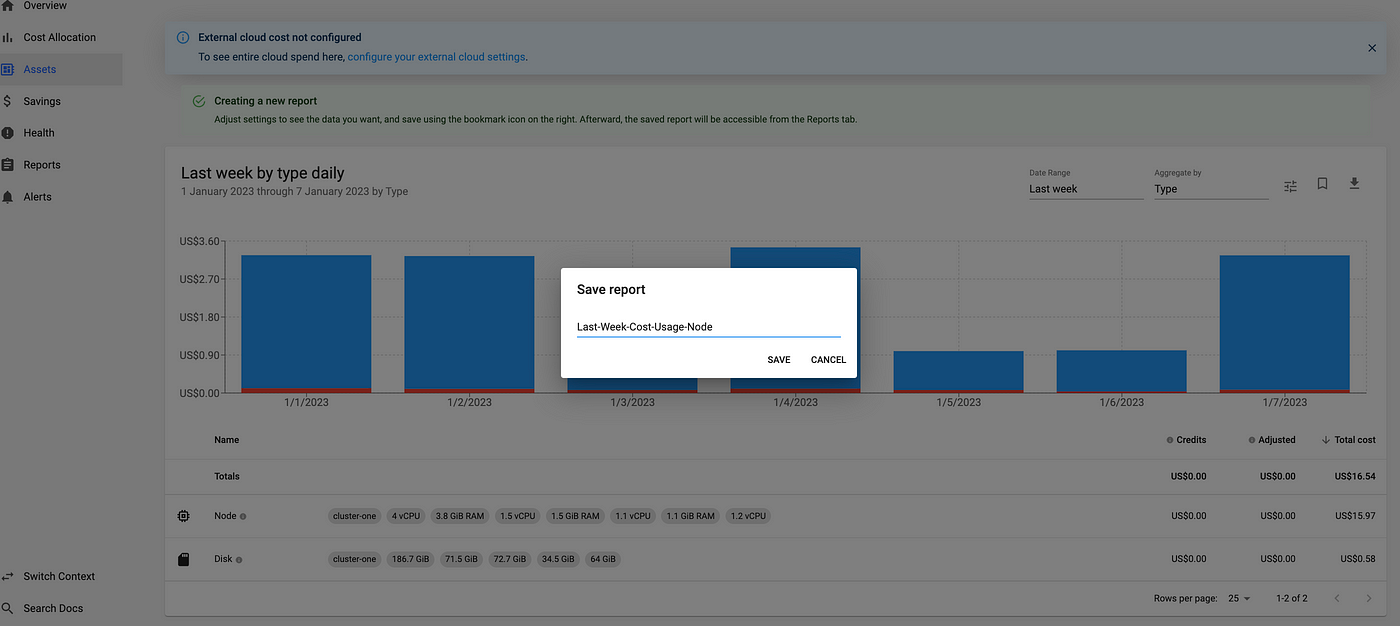
Report:
Select “Report” from Kubecost Dashboard to create report for Assets and Allocations aggregated based on K8s object in given time range.
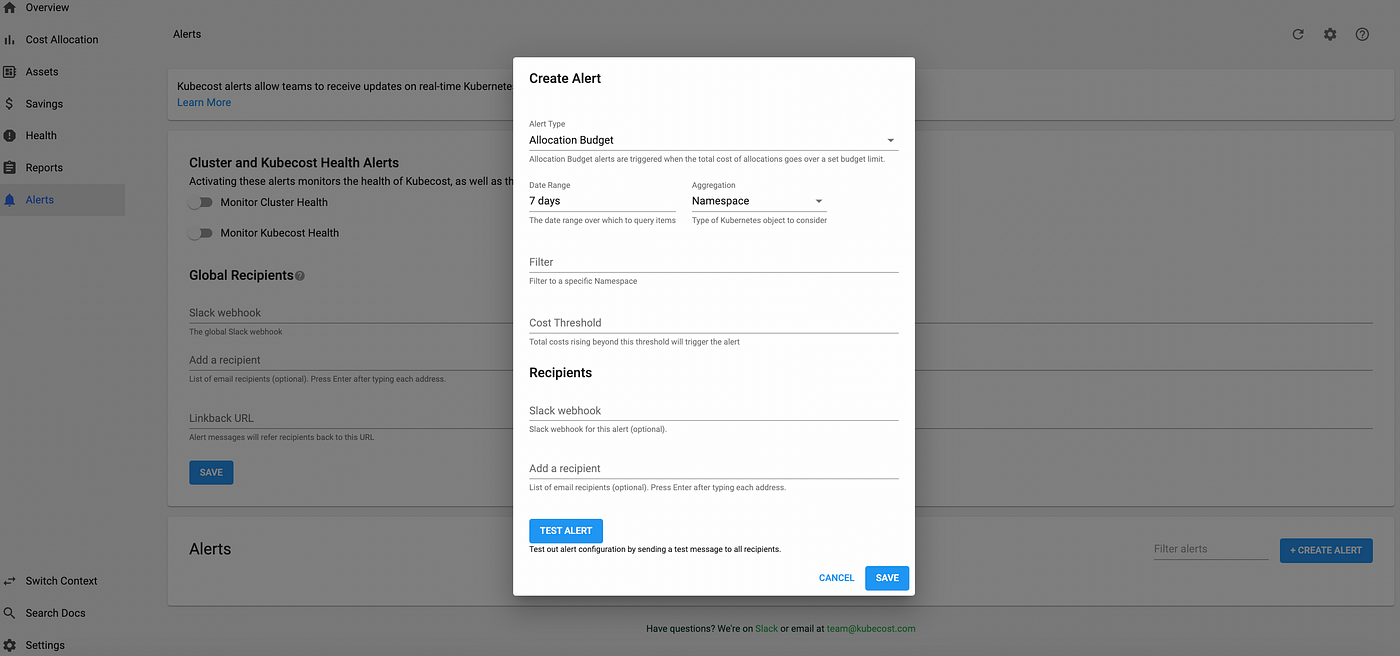
Alerts:
Select “Alerts” from Kubecost Dashboard to create alert to receive updates on real-time K8s Cluster spend, monitor K8s health, monitor Kubecost health etc. It is further integrated with Slack and Pagerduty to notify teams to take apt actions.
Conclusion:
It is not the end because there many other advance features which are still not yet used, Because everything can’t be covered in single article i.e., You can play with custom report, custom alert for budget over-run based on namespace, service etc. For more detail, Please refer below link