Microsoft Fabric is an end-to-end, cloud-based SaaS solution for data and analytics. It is built on top of an open lakehouse (OneLake) and weaves together multiple Microsoft tools to streamline all data and analytics workflows, from data integration to data engineering to data science.
What is Microsoft Fabric, and why is it needed?
Microsoft Fabric is a platform that brings together various Microsoft tools and services. In many organizations, different teams handle different aspects of data management. These include data engineering, data storage in data warehouses (DWH) and data lakes, and data analytics or data science. Typically, each of these teams maintains its own separate data platforms and solutions. This often leads to data duplication and increased costs. This is where Microsoft Fabric comes into play. It aims to unify all these disparate elements into a single platform, eliminating redundancy, reducing costs, and ensuring data security and privacy. Microsoft Fabric introduces the concept of a centralized data repository called “One Lake.” This repository stores data in the widely used Delta Parquet format, an industry standard. The idea is that only one copy of the data is stored centrally in One Lake, which increases efficiency and reduces data duplication across different tools and services.
Microsoft Fabric Highlights:
1. One copy of data – One Lake: Microsoft Fabric introduces “One Lake,” a central repository that ensures only one copy of your data, reducing duplication.
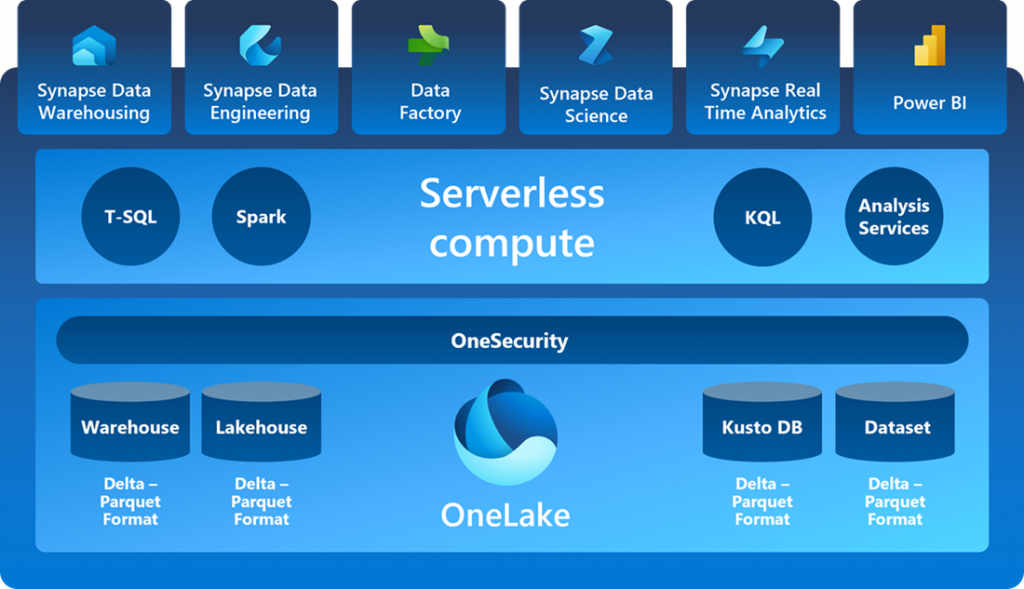
2. Unified Integrated Environment: Microsoft Fabric provides a unified environment where-
- The “Warehouse” works like a database.
- The “Lake House” works like a data lake.
- “Power BI” can access both Warehouse and Lakehouse data.
- You can access and manipulate data through SQL endpoints.
- You can run custom queries and real-time analytics.
- Perform data science experiments.
3. One Security: One Security ensures that permissions are enforced consistently across all engines, increasing data security and simplifying security permission management for organizations using the platform.
4. Common compute: Unlike traditional configurations where you purchase storage for a data lake and separate compute power for a data warehouse, Microsoft Fabric provides a shared compute resource. This shared computing power can be used to process data in the data lake, manage the warehouse, and run analytic queries in Power BI.
5. Components of Microsoft Fabric: Microsoft Fabric brings together the best parts of data mesh, data fabric, and data hub to provide a one-stop shop for data integration, data engineering, real-time analytics, data science, and business intelligence
What is One-Lake in Microsoft Fabric?
Since we have been talking about One Lake, we should talk more about it. One of the most exciting things in Fabric that I have found is OneLake. I was amazed to discover that OneLake is simplified just like OneDrive! The goal of OneLake is to provide a single place for all data, breaking down data silos and simplifying management (security/governance/data discovery) for your organization’s data. The solution is built on the robust foundation of Azure Data Lake Storage Gen2.
Getting Started with Microsoft Fabric – How to Enable Fabric in app.powerbi.com
1. If you want to try Fabric in your tenant, you need to enable the Fabric capabilities in your Power BI admin portal. To do this, go to https://app.powerbi.com/.
Note: You must be a Power BI administrator, and Microsoft Fabric Capacity(Trial) or Power BI Premium Capacity is required to get started with Microsoft Fabric.
2. You can also obtain a free trial version once you activate the trial. You have 60 days to try it.
3. Go to the Power BI service (https://app.powerbi.com) and open the admin portal. (You need administrator rights for Power BI to see this menu item shown below.)
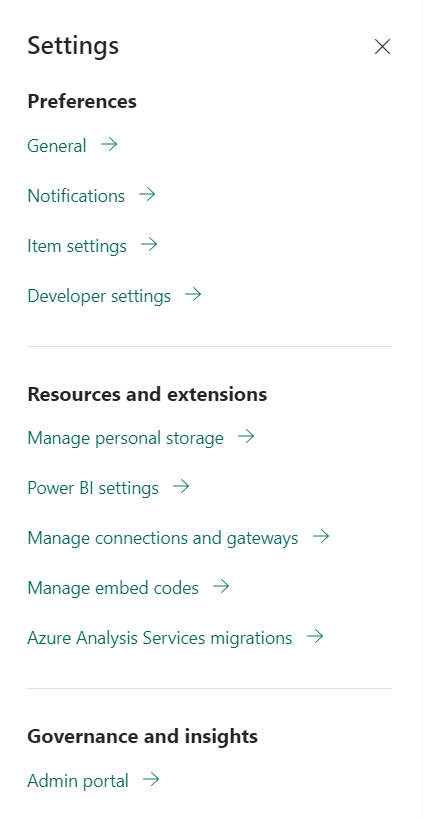
4. Navigate to the Power BI Admin Portal. This must be done by the Power BI tenant administrator or Office 365 tenant administrator. In the Admin Portal, under Tenant Settings, find the first option for Microsoft Fabric (Preview). Enable it. You can enable it for the entire organization or for a specific security group.
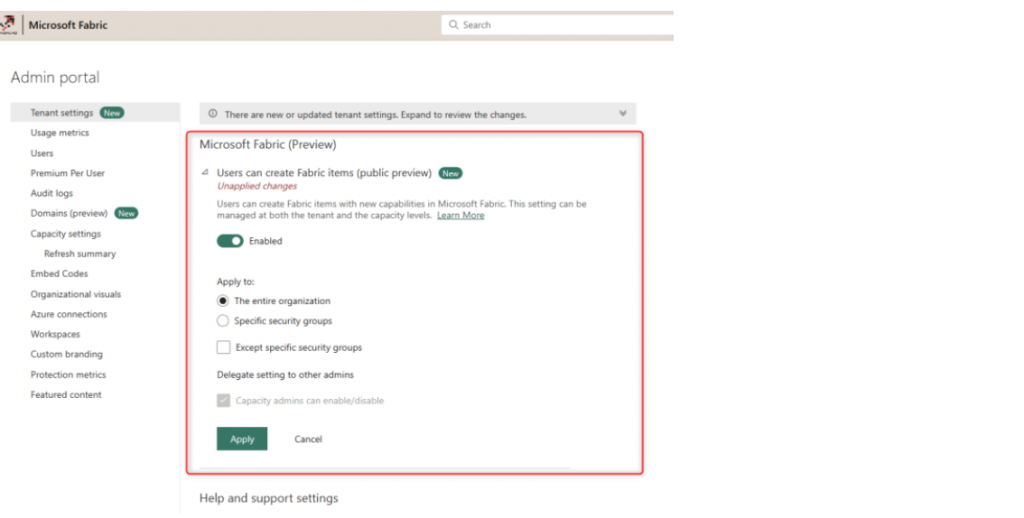
Once you make the change, it will take up to 15 minutes, and then you should see some effects of Microsoft Fabric in your tenant.
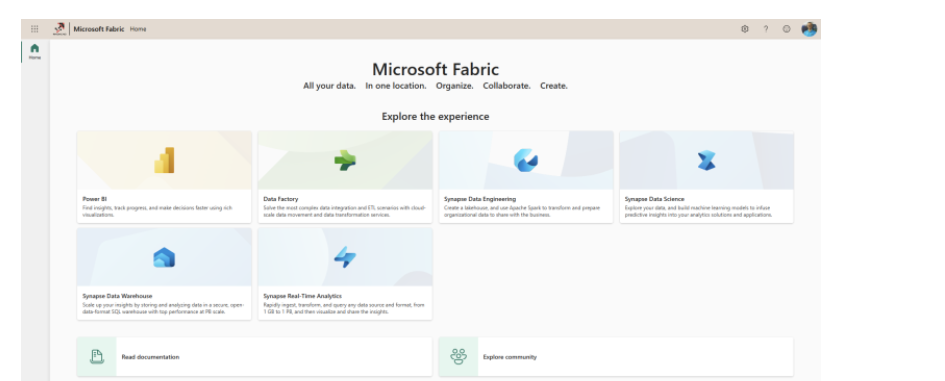
5. In the lower left corner, you will see all the key components. Click the Microsoft Fabric option. You are redirected to the Microsoft Fabric home page.
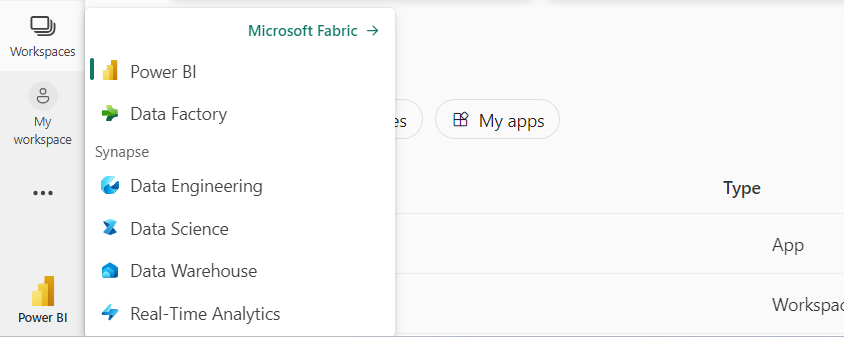
This is the complete Microsoft Fabric home page where you will see other Microsoft Fabric workloads and can navigate to them.
Note: The complete Microsoft Fabric setup can be found at https://learn.microsoft.com/en-us/fabric/admin/fabric-switch
Now that we have Fabric enabled in https://app.powerbi.com/, we can begin the demo to show how we can load the data into the lakehouse, then query data with SQL Endpoint and use the same data set for creating reports in Power BI.
The following steps are required to load the data into Lakehouse.
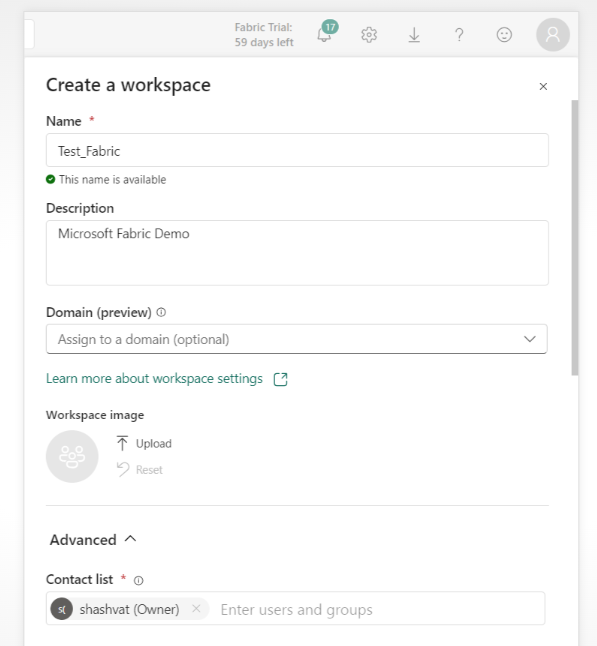
1. To get started, we first created a workspace, “Test_Fabric” in https://app.powerbi.com/.
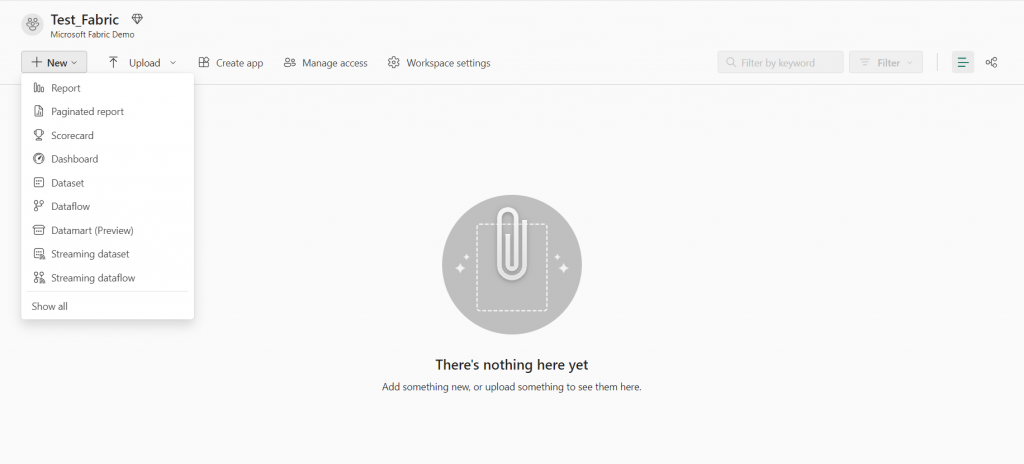
Then, navigate to the “New” option and select “Show All” to explore the various components available.
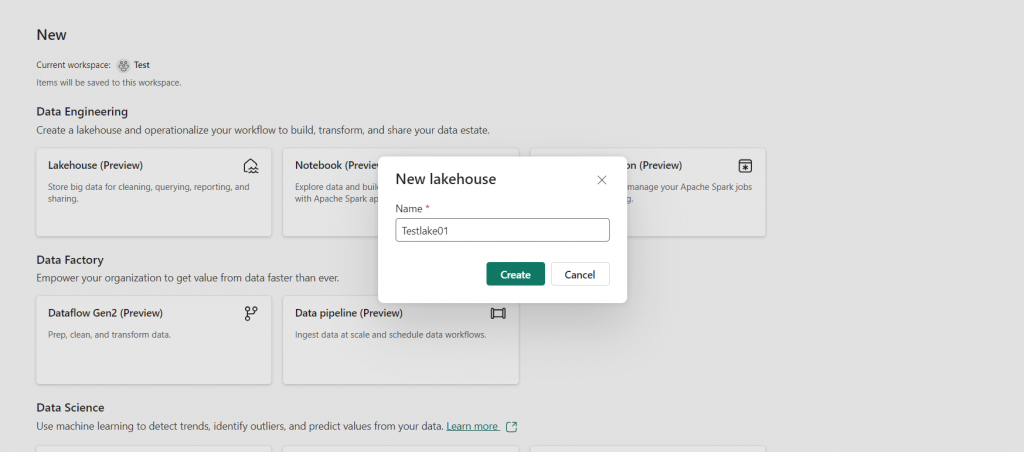
2. For demonstration purposes, we’ll focus on creating a “lake house”.
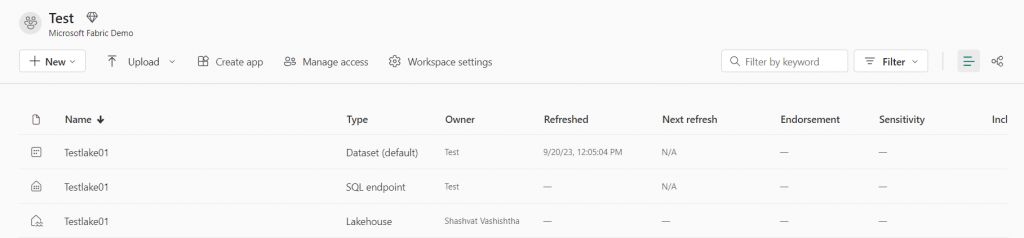
3. Once we’ve successfully created this new lake house, return to your workspace. Here, you’ll see that three components have been created with the same name. These components are:
Lakehouse: This is the main area in which you’ll be working. It serves as the core of your data operations within the Lakehouse environment.
SQL Endpoint: The SQL Endpoint provides read-only access to your data. It allows you to query and retrieve information from your Lakehouse.
Default dataset: This is where you’ll find your data. The default dataset is the location of your data that you can access and work with as needed.
4. The creation of the lake house has been completed. However, it does not yet contain tables or data. So we will add these. There are several ways to load data into the lakehouse. Any of the following methods can be used to load data into the lakehouse.
- Data Flows Gen2
- Data Pipelines
- Notebooks
- Apache Spark job definitions
- The Lakehouse explorer
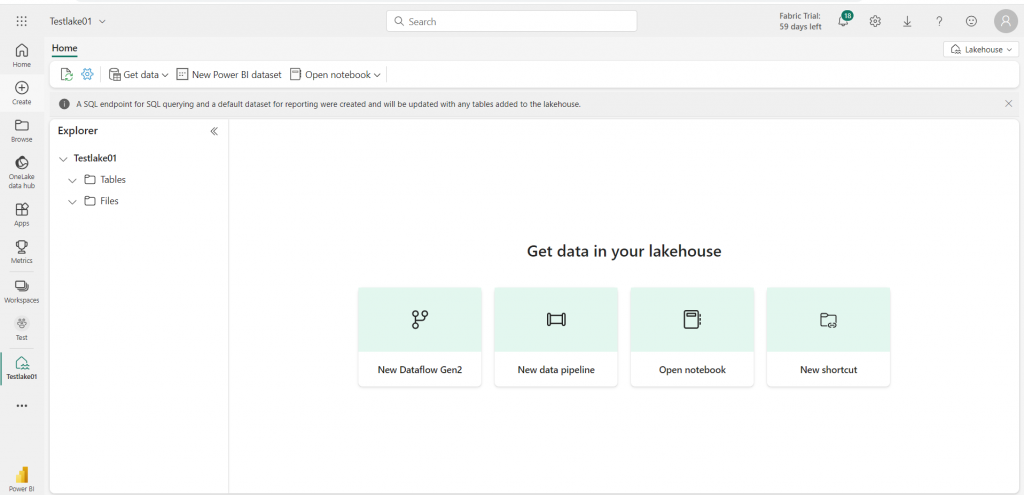
5. Let’s just load data into the lake house by using the data Pipeline. On the home page of your lakehouse, select New Data Pipeline and create a new data pipeline. The copy data wizard will open as shown below.
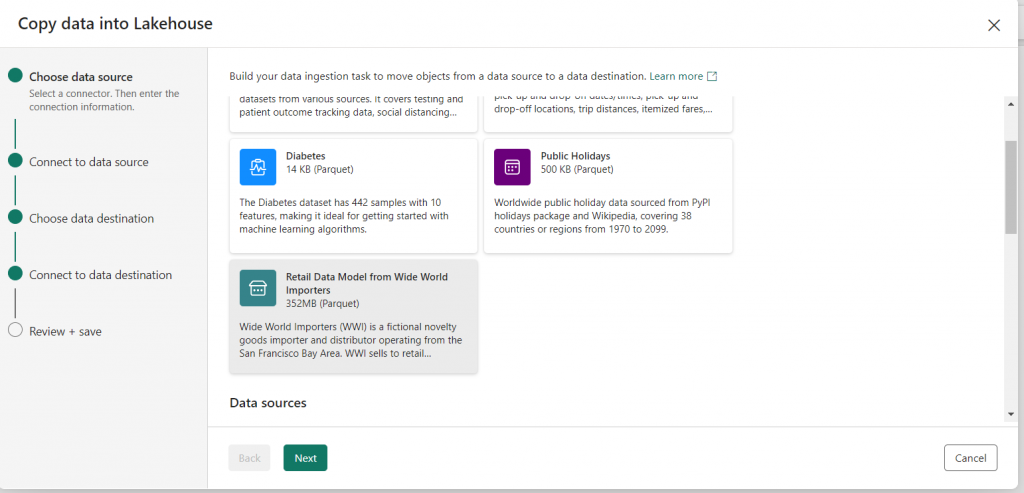
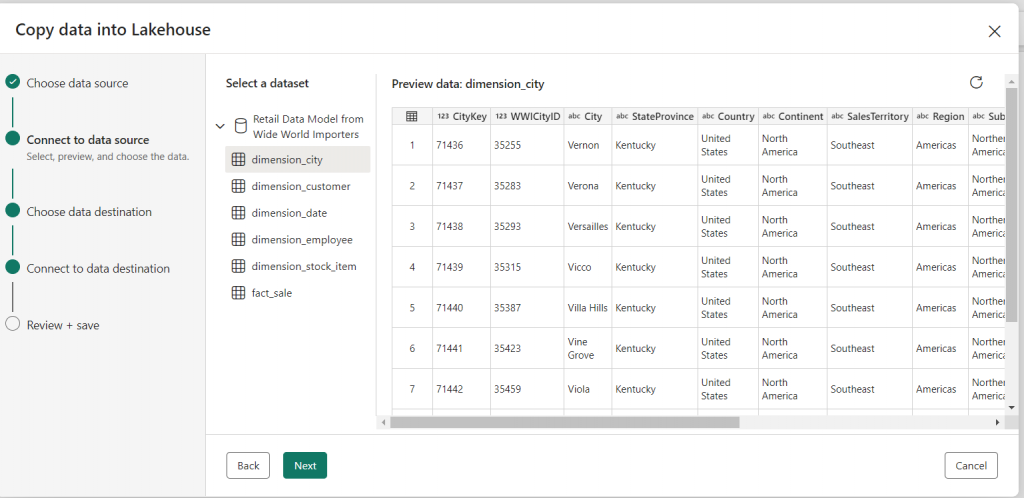
In the copy data wizard, on the Choose data source step, Select the sample data “Retail Data Model from Wide World Importers”. Click “Next” and go to the next step which is “Connect to data source” and select the table that you want to use. Ex dimension_city.
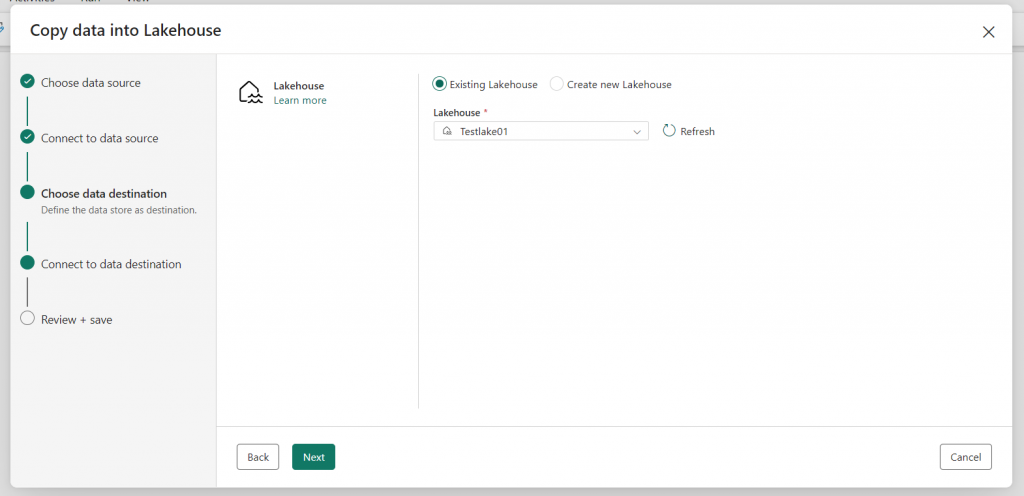
6. Click “Next” and go to the next step which is “Choose data destination”. It will list down all the lake houses that are part of the workspaces.
7. Click “Next” and go to the next step, which is “Connect to data destination.” Here, you can also do a mapping of your column fields. This mapping can also be done later.
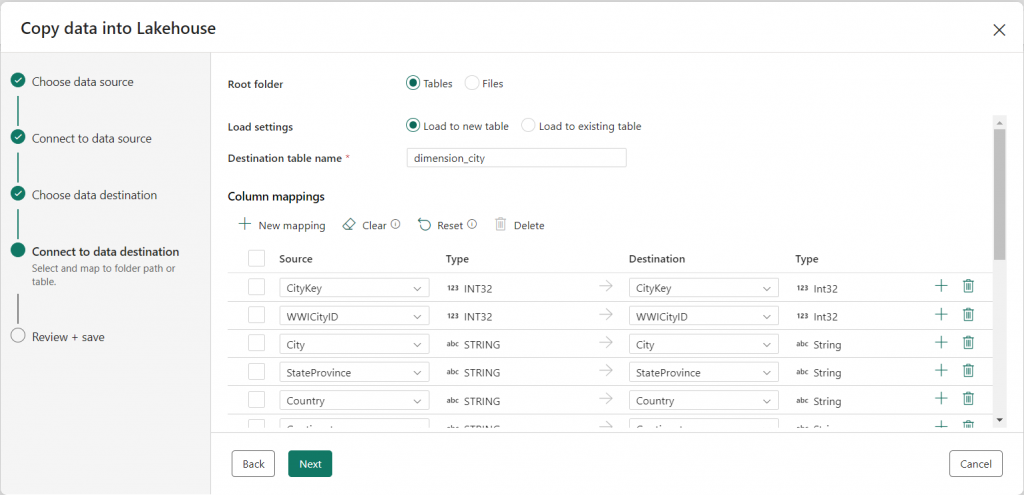
Then click on “Next” and review this and Save.
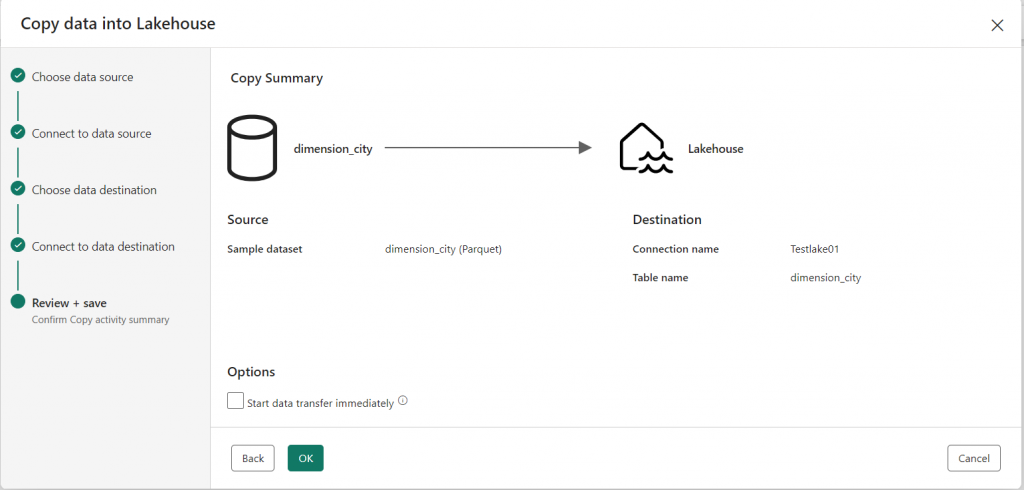
8. A New Screen will open “ Copy summary page”. On the copy summary page, you can review the details of the copy operation, such as previewing the data, correcting the mapping of the columns (e.g., changing the data types, editing the column names, etc.), and then click “Validate” to validate the pipeline, then save it and run the operation.
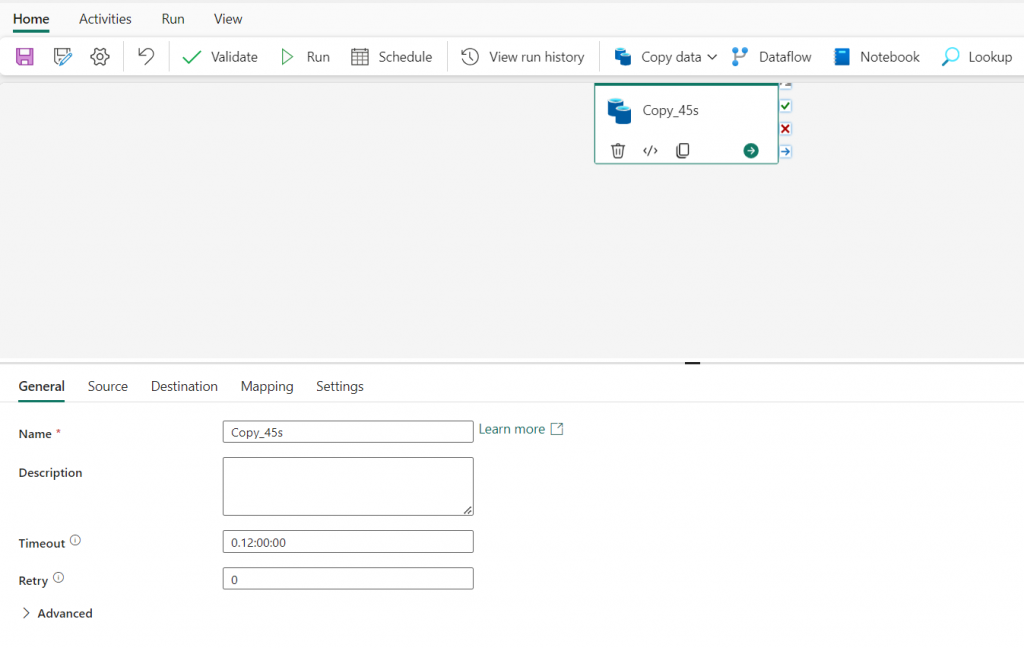
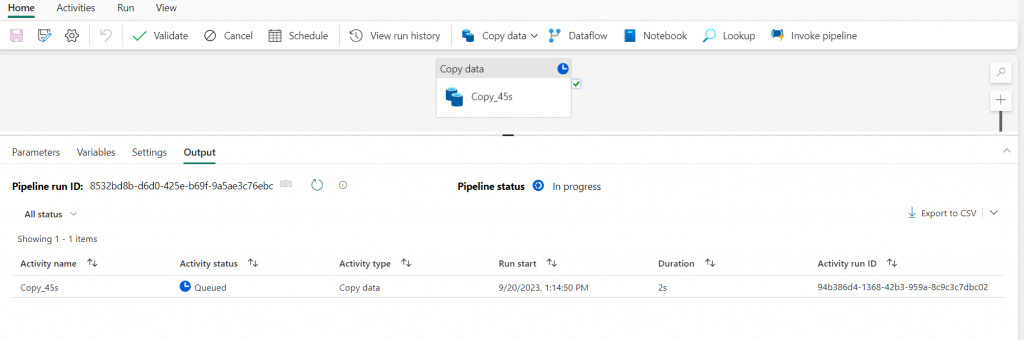
9. When the pipeline starts to run, you can monitor its status in the output area under the pipeline designer. Use the ↻ (Refresh) icon to update the status and wait until it succeeds. Repeat these steps (3 to 7) to add new tables.
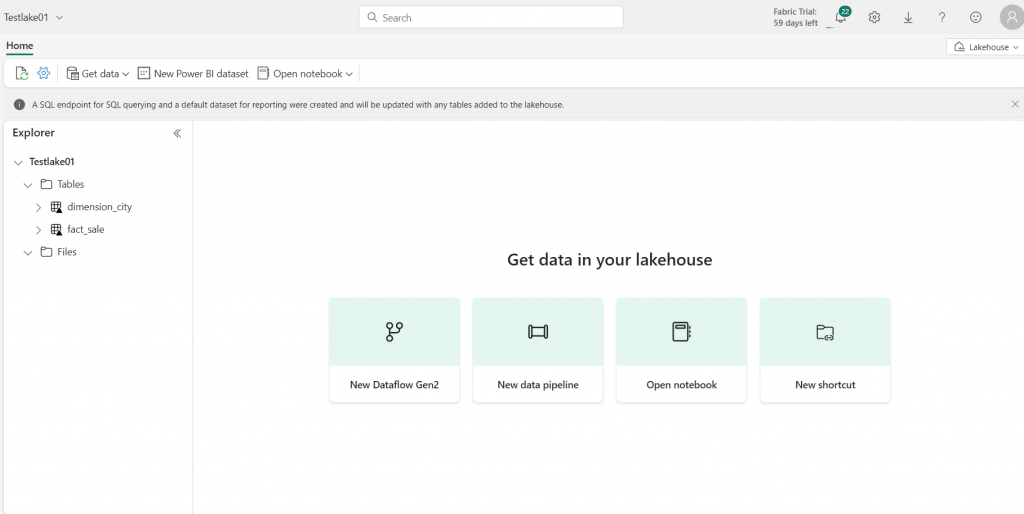
10. Go to the lakehouse, and here you can find the tables that you copy in the lakehouse. These are two tables that are loaded here: dimension_city and fact_sale. You can also create views.
11. Select “SQL Endpoint” from the dropdown menu in the upper right corner and preview your data by selecting one of the tables as shown below.
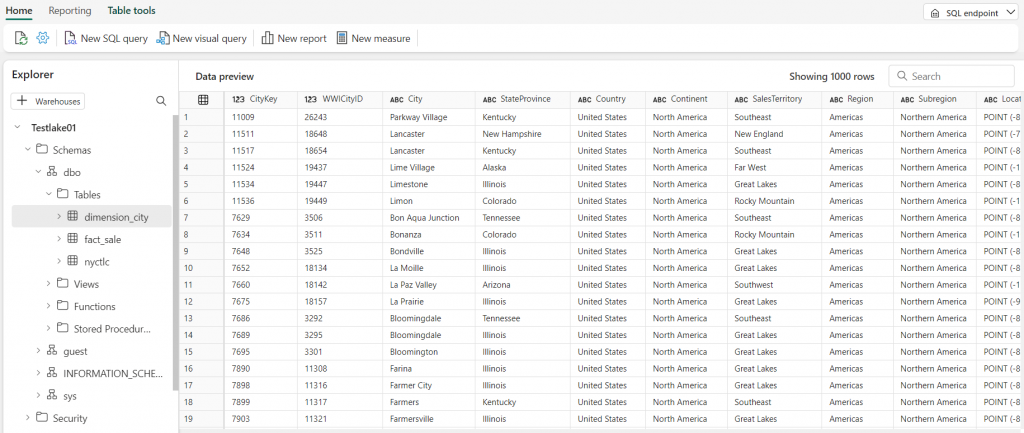
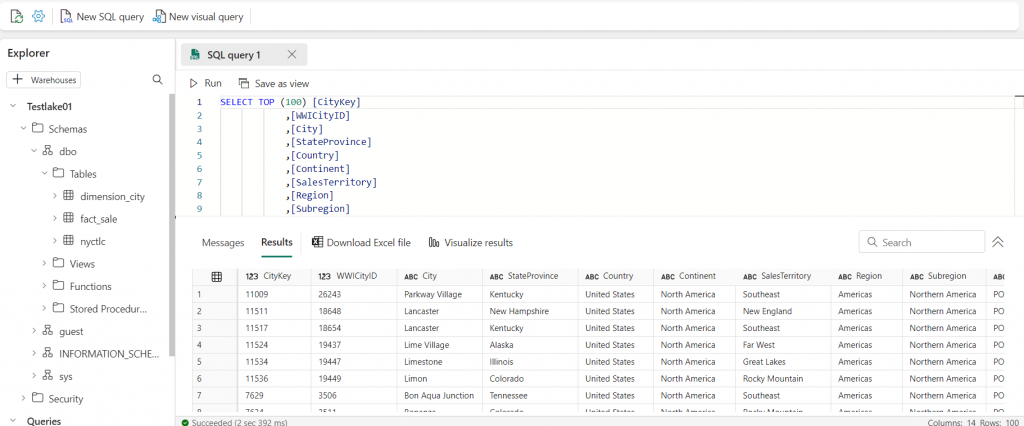
You can also query the data using SQL.
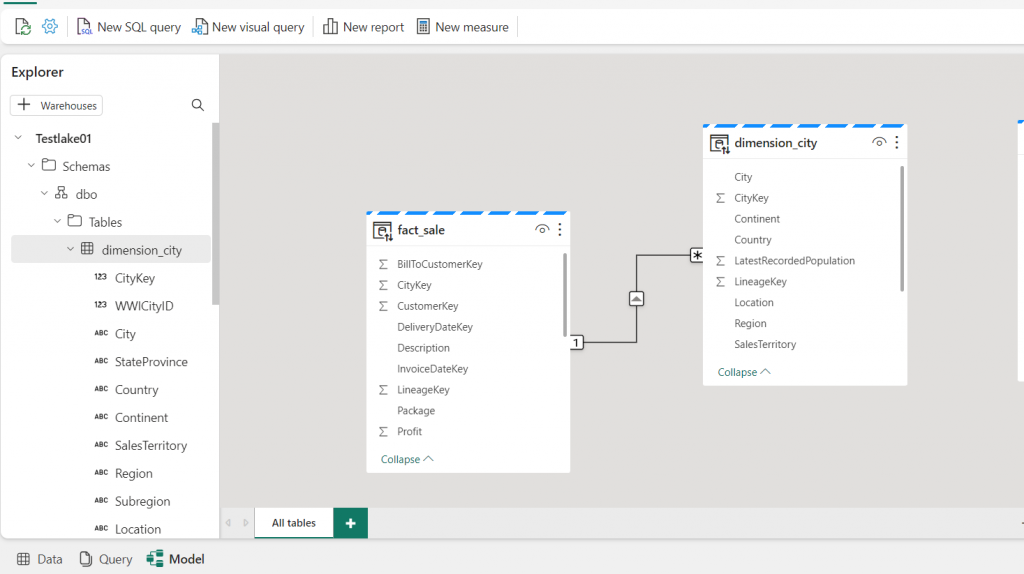
12. Select the Model tab at the bottom and create a data model. Below is an example of a data model where I connected the two tables using the CityKey column. Here dimension_city is a dimension table/lookup table, and fact_sales is a fact table.
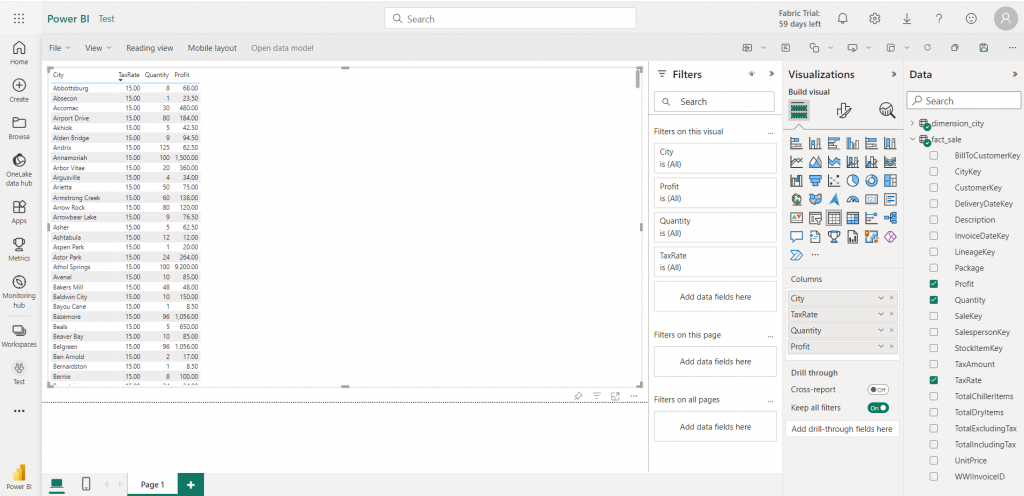
13. Once the data model is created, you need to click on “New Report”. This will open Power BI Wizard where you can create new reports.
With the process written above, you can load the data into the lakehouse. There are other ways by which you can load the data into the lakehouse, like using Dataflow GEN2, Notebooks Apache Spark job definitions, etc.
Here are the Quick Links for Microsoft Fabric:
Official Document: https://learn.microsoft.com/en-us/fabric/get-started/fabric-trial
Buy a Microsoft Fabric subscription: https://learn.microsoft.com/en-us/fabric/enterprise/buy-subscription
Summary
Microsoft Fabric simplifies the data analytics landscape. By integrating various tools and services under one umbrella, it allows organizations to focus on results rather than the complexities of technology.