Continuing with my previous blog on Cloud Infrastructure Monitoring with Datadog, we would now be monitoring the application level with Datadog. My use-case was that I needed to monitor my PHP application, get deeper insights for it and also monitor the various Nginx metrics. So, I decided to try out Datadog Monitoring tool.
In this blog we will learn how to monitor a PHP WordPress application ( you can use any other PHP application ), being served through Nginx ( you may serve it through Apache as well, edit the apache.yaml file lying in the same directory as nginx.yaml that we will be talking about later ), which is using RDS MySQL database ( or you might use simple MySQL db running on the same server ).
Prerequisites:-
1. Datadog agent installed on your Ubuntu/Debian server.
2. A PHP application running on your server.
3. Nginx installed on your server, serving your PHP application
Just refer to my previous blog for Datadog agent installation.
Steps to setup the metrics for PHP
Go to Integrations -> Integrations & search for PHP & enable it. For using it, firstly you need to git clone the following directory.
[js]
git clone https://github.com:DataDog/php-datadogstatsd.git
[/js]
Go into the directory php-datadogstatsd. It will look as follows :-
![]()
When you move into libraries directory, you will see a PHP file. This is the library file for each metric for PHP.
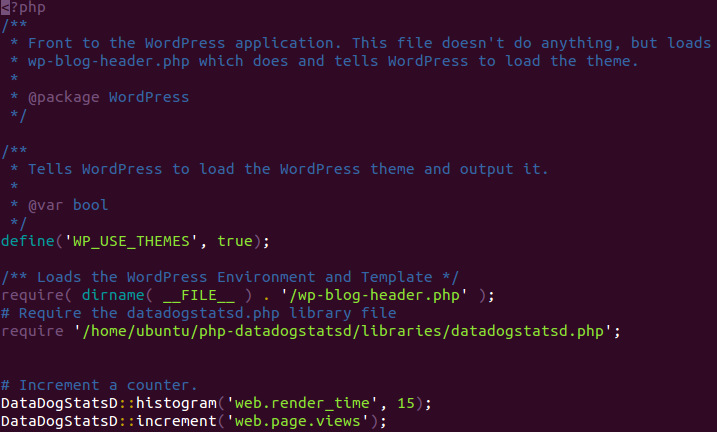
Open your index.php file & append the required lines :-
[js]
# Require the datadogstatsd.php library file
require ‘./libraries/datadogstatsd.php’;
# Increment a counter.
DataDogStatsD::increment(‘web.page.views’);
DataDogStatsD::histogram(‘web.render_time’,15);
[/js]
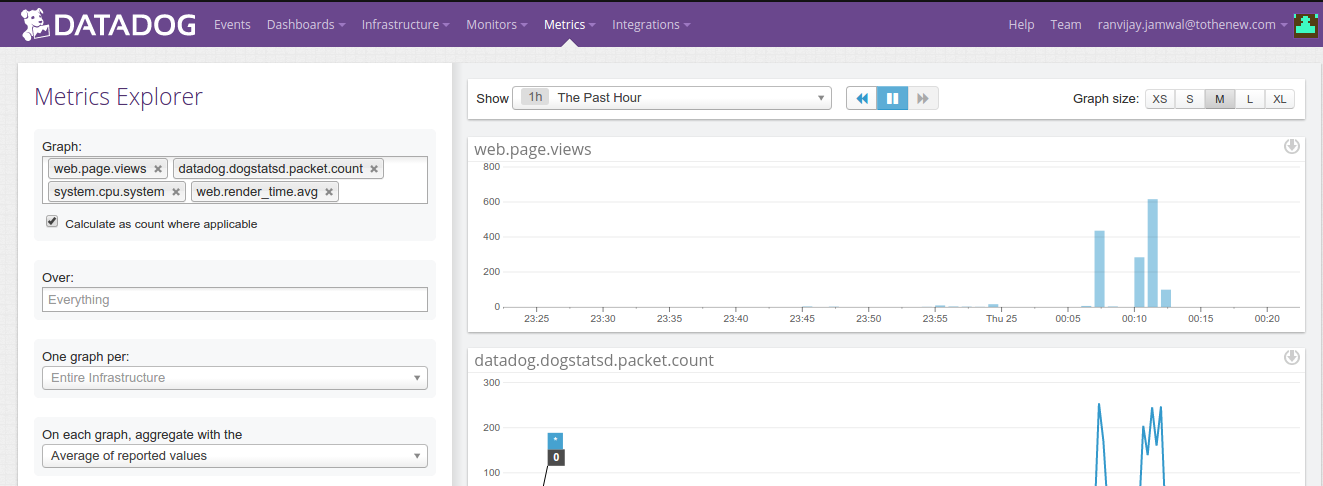
“web.page.views” & “web.render_time” are few of the metrics which are available. For more examples of metric refer to the example.php file inside the php-datadogstatsd directory. You can use them or create your own which would obviously require some coding.
Hit your website for 3-5 times for the API calls to become active. Within a couple of minutes the metric will start to show in the graph list where you can choose for which metric you need the graph to be visible on the right side just as below :-
Now, we would come to Nginx monitoring and for that we need to install the Nginx Integration from the Integrations menu in the Datadog dashboard.
Next, we need to go the server where Datadog is installed & check for the http_stub_status module. ( whether it is available to us or not ). For that you can run the command :-
[js]
nginx -V | grep http_stub_status
[/js]
Now, since the module is available, go ahead and open the virtual host file of Nginx in this case and inside the server block enter the following lines of code :-
   location /nginx_status {
        stub_status on;
        access_log off;
        #can be switched on as well
        #Only allow access from XXX.XXX.X.XXX IP
        allow XXX.XXX.X.XXX;
        #XXX.XXX.X.XXX is your server IP
        # Send rest of the world to /dev/null
        deny all;
   }
Now, just restart or use reload Nginx. You can run :-
[js]
service nginx reload or service nginx restart
[/js]
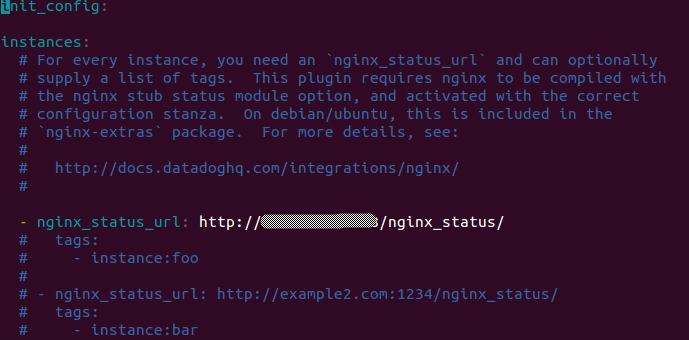
You need to edit one more file which you will find in /etc/dd-agent & then look for nginx-example.yaml. Rename the file to nginx.yaml. Remember this is a yaml file & indentation is the core of writing anything in it. Open the file & enter something like below ( hidden part is the IP address of my server):-
Don’t forget, you also need to restart the Datadog agent for it to read the newly created nginx.yaml file.
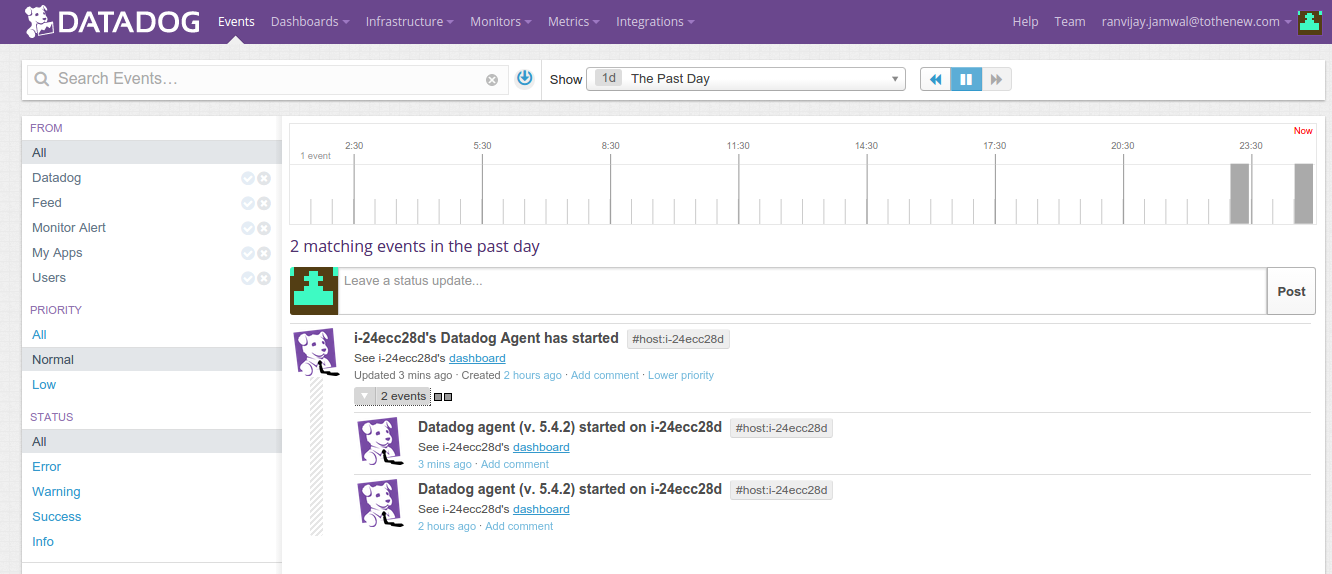
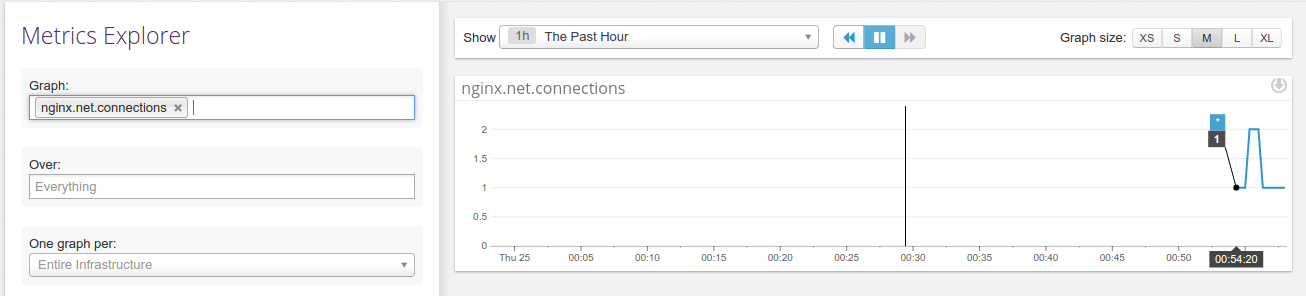
In events, you can see that the Datadog agent has restarted. Next, would be to check the metrics. Go to Metrics Explorer.
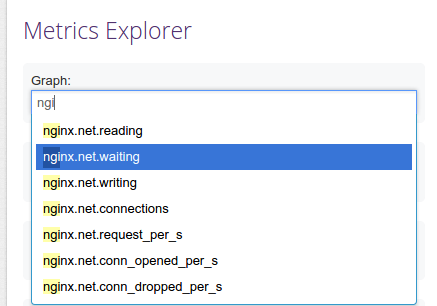
You will now see new entries starting with Nginx. Just select the metric you want to monitor.
You are now done. You can also go ahead & create alerts for whatever you want as we discussed in the previous blog which can be referred at http://goo.gl/ljg5jk.