While working with Google charts, we usually face issues with long labels on the horizontal axis.
The chart displays well, however the X-axis labels are not completely visible and displays the numbers like this: 24/3.. 25/3.. 26/3.. 27/3.. 28/3.. 30/3.. 31/3.. instead of
24/3/2006, 25/3/2006, 6/3/2006, 27/3/2006, 28/3/2006, 30/3/2006, 31/3/2006
The usual practice that we all apply is that we shorten the labels and create a legend to explain what the labels actually represent.
This blog will help you with an alternate solution to this issue by using vertical labels.
Here you go:
Step 1 : Include Google API in your head tag :
[java]google.load("visualization", "1", {packages: ["corechart"]});
google.setOnLoadCallback(drawMyChart)[/java]
Step 2 : Create a DIV, where you want to draw your chart :
[java]<div id="myChart"></div>
[/java]
Step 3 : Create a data for your ComboChart :
[java]var data = google.visualization.arrayToDataTable([
[‘Month’, ‘Bolivia’, ‘Ecuador’, ‘Madagascar’, ‘Papua New Guinea’, ‘Rwanda’, ‘Average’],
[‘2004/05/01’, 165, 938, 522, 998, 450, 614.6],
[‘2005/06/01’, 135, 1120, 599, 1268, 288, 682],
[‘2006/07/01’, 157, 1167, 587, 807, 397, 623],
[‘2007/08/01’, 139, 1110, 615, 968, 215, 609.4],
[‘2008/09/01’, 136, 691, 629, 1026, 366, 569.6]
]);
[/java]
Step 4 : Define options for your chart :
[java] var options = {
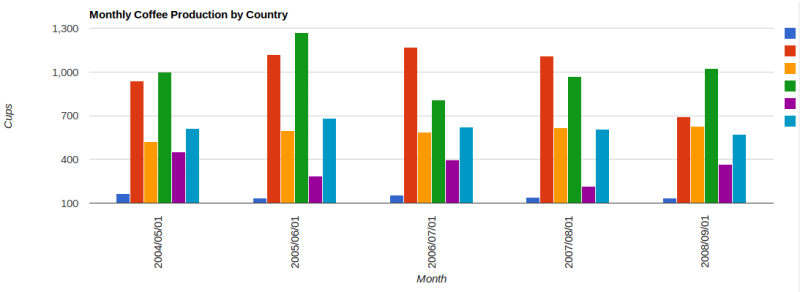
title: ‘Monthly Coffee Production by Country’,
height: 350,
seriesType: "bars",
vAxis: {
title: "Cups"
},
hAxis: {
title: "Month",
slantedText: true, /* Enable slantedText for horizontal axis */
slantedTextAngle: 90 /* Define slant Angle */
},
‘chartArea’: { ‘width’: ‘82%’, height: ‘60%’, top: ‘9%’, left: ‘15%’, right: ‘3%’, bottom: ‘0’} /* Adjust chart alignment to fit vertical labels for horizontal axis*/
};
[/java]
Add parameter options with ‘slantedTextAngle’ : 90 degree to show label vertically
Step 5: Add above 2 block of codes inside ‘drawMyChart’ function, and then draw your Combo Chart:
[java]function drawMyChart(){
var data = …
var options =
…
}
var chart = new google.visualization.ComboChart(document.getElementById(‘chart_div’)); /* Define your ComboChart object */
chart.draw(data, options); /* draw the chart using above define ‘data’ and ‘options’ */
}[/java]
The chart looks like this now:
Hope this helps everyone!
Reach out to me for any queries at mansi[at]intelligrape[dot]com
Very nice article. I am new to Google Chart API. I have very simple requirement to print data in table format and also showing charts. want to know how to show printable tables (like HTML tables) , Charts etc. Please help me. Also want to export in pdf files. Thanks in advance.