
7 Things You Must Know About Load-Testing Using JMeter
Load testing is a must-do task for the infrastructure benchmarking. Performing load test in a proper way and analysis of load test results are the two main points which tells you the performance of your infrastructure.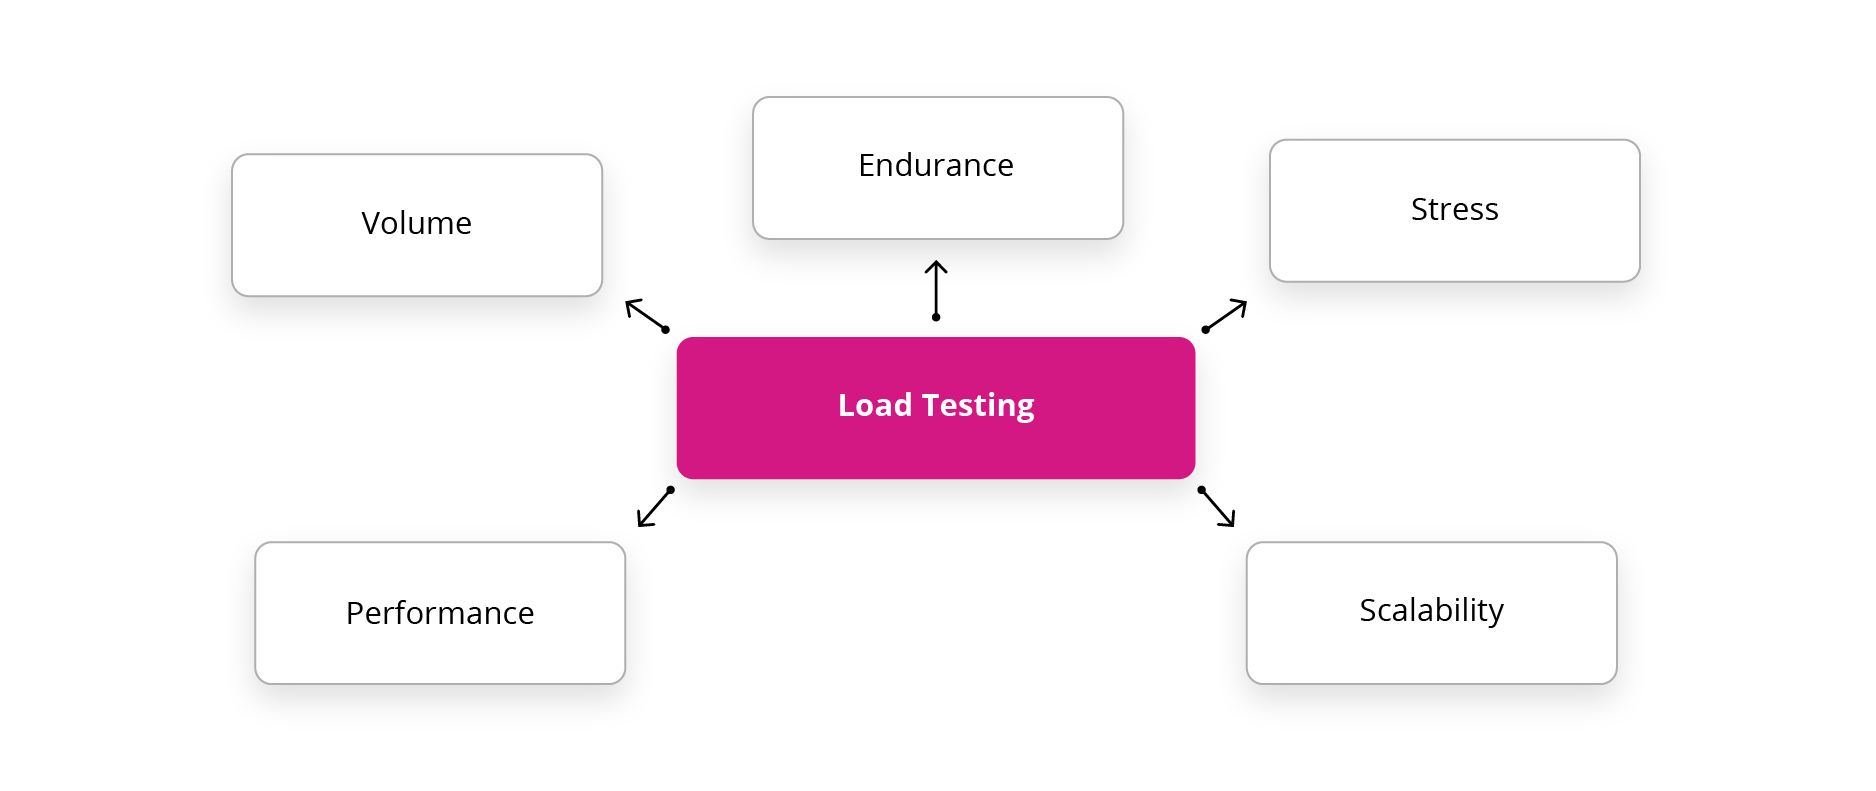
In this blog, I’ll be covering the key points which one should keep in mind to achieve the benefits of load testing in an optimum manner. I am using AWS EC2 servers for this purpose.
1) JMeter Setup: In order to achieve the best results, one should use the master-slave setup of load test so that the concurrency parameter of load testing is preserved. Its not recommended at all to do the load testing using a single server. Load testing using single server may lead to incorrect results as the underlying single Jmeter server can be a bottleneck in terms of network and memory parameters. Its always recommended that one should use multiple servers while firing hits on the application. Master server can be small sized instance but the slaves, which actually hits the application should be high performance instances. The best way is to spawn slaves servers in multiple regions in AWS to attain a flavour of real time load. The reference to setup master-slave Jmeter in multiple regions is here.
2) Tuning the Jmeter: Its very important to tune the JVM arguments so that the resources of JMeter are fully utilized to provide the best performance.
– Heap Size: Increase the Heap size of JVM which JMeter will be using and set this parameter according to the resources allocated to the server. You can set this parameter in JMeter’s configuration file. Heap size is the space which JVM uses to create the necessary objects during the test run. By default, Its 512 Megabytes which is very less and your test might end up failing raising outofmemory error.
– Tuning the Eden space parameter: If you are increasing the heap size then you should also tune the NEW parameter in JMeter startup script as it says the eden space should also be widened heap space is getting wider. It helps in decreasing the frequency of minor GC.
– Enable Server mode in JVM: In this mode, JVM throughput is better and improved. The server mode produces highly optimized JIT compilations yielding a higher performance.
– Enable -d64 mode in JVM: If you are using a 64-bit OS then use this parameter to tell JVM explicitly about your OS.
– UseConcMarkSweepGC (Recommended for JMeter): In this case, the young generation garbage collection is done in parallel mode and the old generation garbage collection will be done through Concurrent Mark Sweep. This way we can achieve concurrency plus high efficiency.
– Instance Type: Always use Memory Optimized EC2 instances for load testing purpose.
– Tuning the Linux machine for both master and slave servers:
You can execute the below script as it is to tune the Linux servers.
[js]
#!/bin/bash
# Increase system file descriptor limit
sudo sysctl -w fs.file-max=100000
# Increase Linux autotuning TCP buffer limits
# Set max to 16MB for 1GE and 32M (33554432) or 54M (56623104) for 10GE
# Don’t set tcp_mem itself! Let the kernel scale it based on RAM.
sudo sysctl -w net.core.rmem_max=33554432
sudo sysctl -w net.core.wmem_max=33554432
sudo sysctl -w net.core.rmem_default=33554432
sudo sysctl -w net.core.wmem_default=33554432
sudo sysctl -w net.core.optmem_max=25165824
sudo sysctl -w net.ipv4.tcp_rmem="87380 16777216 33554432"
sudo sysctl -w net.ipv4.tcp_wmem="65536 16777216 33554432"
# Make room for more TIME_WAIT sockets due to more clients,
# and allow them to be reused if we run out of sockets
# Also increase the max packet backlog
sudo sysctl -w net.core.netdev_max_backlog=50000
sudo sysctl -w net.ipv4.tcp_max_syn_backlog=30000
sudo sysctl -w net.ipv4.tcp_max_tw_buckets=2000000
sudo sysctl -w net.ipv4.tcp_tw_reuse=1
sudo sysctl -w net.ipv4.tcp_fin_timeout=10
sudo sysctl -w net.ipv4.tcp_syncookies=1
sudo sysctl -w net.ipv4.tcp_synack_retries=3
sudo sysctl -w net.core.somaxconn=8096
# Increase ephermeral IP ports
sudo sysctl -w net.ipv4.ip_local_port_range="18000 65535"
#sudo sysctl -w net.ipv4.netfilter.ip_conntrack_tcp_timeout_time_wait=1
# Number of times SYNACKs for passive TCP connection.
sudo sysctl -w net.ipv4.tcp_synack_retries=2
# Disable TCP slow start on idle connections
sudo sysctl -w net.ipv4.tcp_slow_start_after_idle=0
# If your servers talk UDP, also up these limits
sudo sysctl -w net.ipv4.udp_rmem_min=8192
sudo sysctl -w net.ipv4.udp_wmem_min=8192
# Log packets with impossible addresses for security
sudo sysctl -w net.ipv4.conf.all.log_martians=1
[/js]
3) Always run the JMeter test in Non-GUI mode: JMeter is not designed to run heavy loads in GUI environment. The GUI environment consumes additional resources which can affect the performance of your load test leading to incorrect results.
4) Result Analysis: There are many ways to analyse the JMeter test results. Its a best practice to disable all the listeners when you are running the test in non-GUI mode.
At the end of the test you can open the result file with any listeners in GUI mode to analyse the result.
You can use Jenkins “Performance Plugin” for the result analysis. It will show you all the tabular and pictorial representation of response time metrices.
Ant utility to convert XML to HTML using xslt stylesheet.
5) Make a realistic JMX: Its very important to design the JMX file in such a way that it resembles with the real traffic. The JMX should be a mix of various kind of http samplers with different controllers. You can use random controllers, random order controllers within transaction controllers with additional flavour of timing pauses and waits using various types of timers.
6) Choose the values of 3 important variables wisely: The value of variables Thread group, ramp-up time and Loop count should be identified carefully keeping in mind the type of load test you want to perform. A basic example of master-slave scenario explaining these variables is here:
Thread Group: It is the number of requests that each slave will shoot on the target.
Ramp-up time: The time duration in which all the hits will be sent to the target or the time duration in which the JMeter will shoot all the hits from its end.
Loop Count: The number of iterations of the above set up. If you want consistent load for a long time for the purpose of stress testing, you can set a larger value of loop count or even set it as ‘forever’ after defining start time and end time in scheduler.
Example: Suppose I have 1 master server and 3 slave servers and I have 6 http requests in my JMX file. If I set thread group as 50 and ramp-up as 10 seconds, then each slave will send 50 hits individually on 6 http requests and the time duration in which it will complete this work is 10 seconds. This means, that at the end of the test, I’ll have 150 hits on every 6 https requests. The whole process is simultaneous. You can also say that in a total duration of 10 seconds, I’ll get 150 hits on each request from 3 different locations. If i set loop count as 10, then the process will get repeated for 10 iterations and I’ll have 1500 hits on every request after the completion of test.
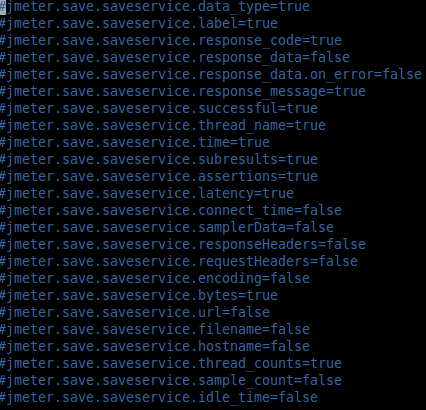
7) Listener’s configuration: While running the JMeter test in non-GUI mode, you
can specify what all things should be logged in the listeners file. You can specify the required things in the file jmeter.properties. Some parameters like logging request and response headers can consume memory so try not to include them in the result.
By following above steps, you can tune your JMeter setup for better efficiency and performance. In my next blog i will write more about Jmeter and Load-Testing.


awesome information! Thx for sharing 🙂
The post is informative. Thank you. I have q query-We have used master and slave concept to run jmx file and ran the file in non-GUI mode. extracted results.csv file and browsed in Jmeter UI to analyse the results. Is there anyway to know the results per slave(to see results on which slave what’s the performance numbers/time taken). As of now not able to see slave info in the results file. Is it possible to get this.
Hi Lakshmi, you can filter out the desired results by extracting & calculating the gathered information from the log files of individual jmeter slave instance.
Suggestion :- Now jmeter 3 has updated inbuilt support for the various kind of dynamic interactive reports. It provides various kinds of metrices. You can use same jmx with jmeter 3 and generate interactive reports.
command :- jmeter -n -t /path/to/testplan -l /path/to/result.jtl -e -o /path/to/dashboard/folder
This will generate ready to serve index.html with interactive reports of the load test.
Very useful !!
simplified and informative!!
Thanks Ankur.