I recently had to add charts to a web page in my project. I used Highcharts library for this. It is very dynamic allowing you to change graphs even after the chart has been drawn.
To display a graph we need a div with an ID. Let’s say we have div with ID “chartDivId” and we want to display two lines in the chart. We can use the below for doing this.
[code language=”javascript”]
<div id="chartDivId">
</div>
<script>
var myChart = new Highcharts.Chart({
chart: {
renderTo: ‘chartDivId’
},
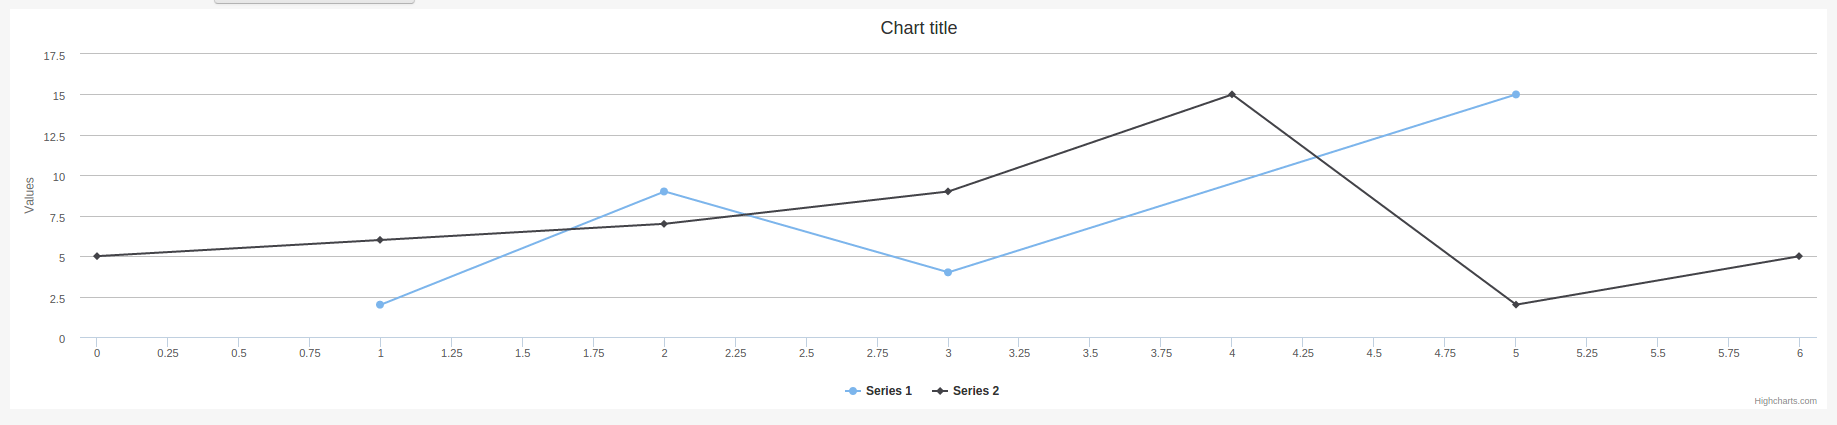
series: [{
data: [[1, 2], [2, 9], [3, 4], [5, 15]]
},
{
data: [5, 6, 7, 9, 15, 2, 5]
}]
});
</script>
[/code]
Using the above I was able to get this chart. Quite easy? Wasn’t it?
A few things about the above code
- Here the series element is to add series to the chart. Each one needs to have a data element which is used to add particular points to the series.
- renderTo specifies the divId to which chart needs to be rendered.
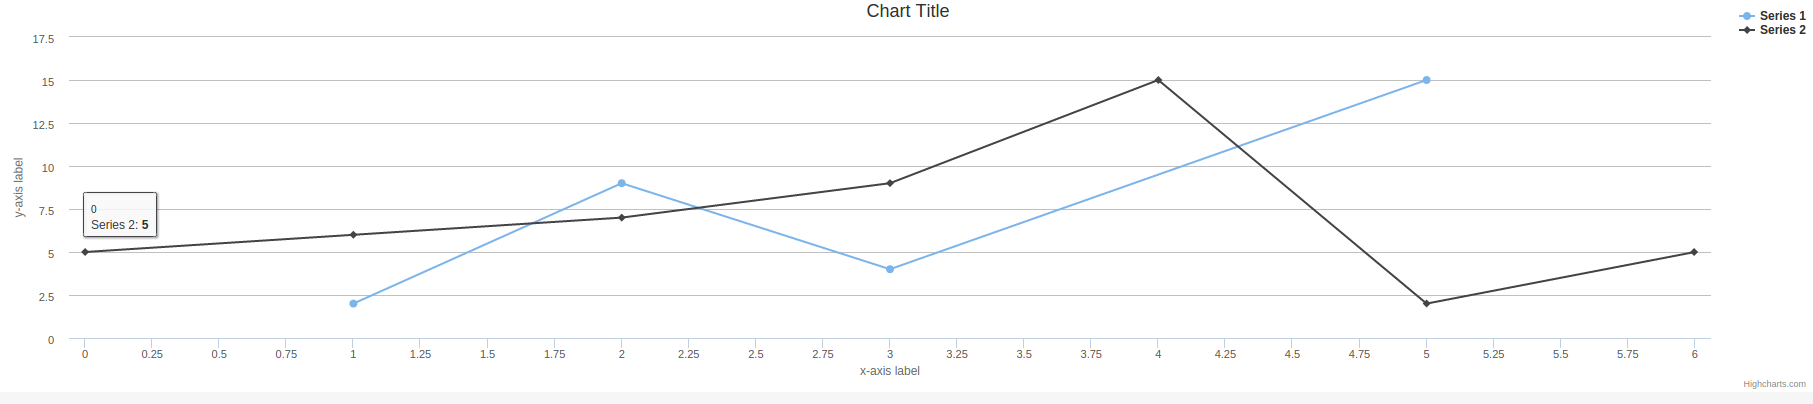
Changing xAxis, yAxis, Chart title, changing legend positions etc. can be done by simply changing the above to this.
[code language=”javascript”]
var myChart = new Highcharts.Chart({
chart: {
renderTo: ‘chartDivId’
},
series: [
{
data: [[1, 2], [2, 9], [3, 4], [5, 15]]
},
{
data: [5, 6, 7, 9, 15, 2, 5]
}
],
xAxis: {
title: {
text: ‘x-axis label’
}
},
yAxis: {
title: {
text: ‘y-axis label’
}
},
title: {
text: ‘Chart Title’
},
legend: {
align: ‘right’,
verticalAlign: ‘top’,
layout: ‘vertical’
},
tooltip: {
pointFormat: ‘<span style="color:{series.color}">{series.name}</span>: <b>{point.y}</b><br/>’,
shared: true
}
});
[/code]
Just doing this I was able to change the chart to below. A tooltip for comparing the various lines.
Even after the chart has been drawn we can change it. The variable mychart that we have used contains a Chart object which allows us to access the chart which is currently on screen. I ran the below via the console and I added a new series to the chart.
[code language=”javascript”]
myChart.addSeries({ data: [1, 2, 3, 4, 5, 6, 7, 8, 9, 10]});
[/code]
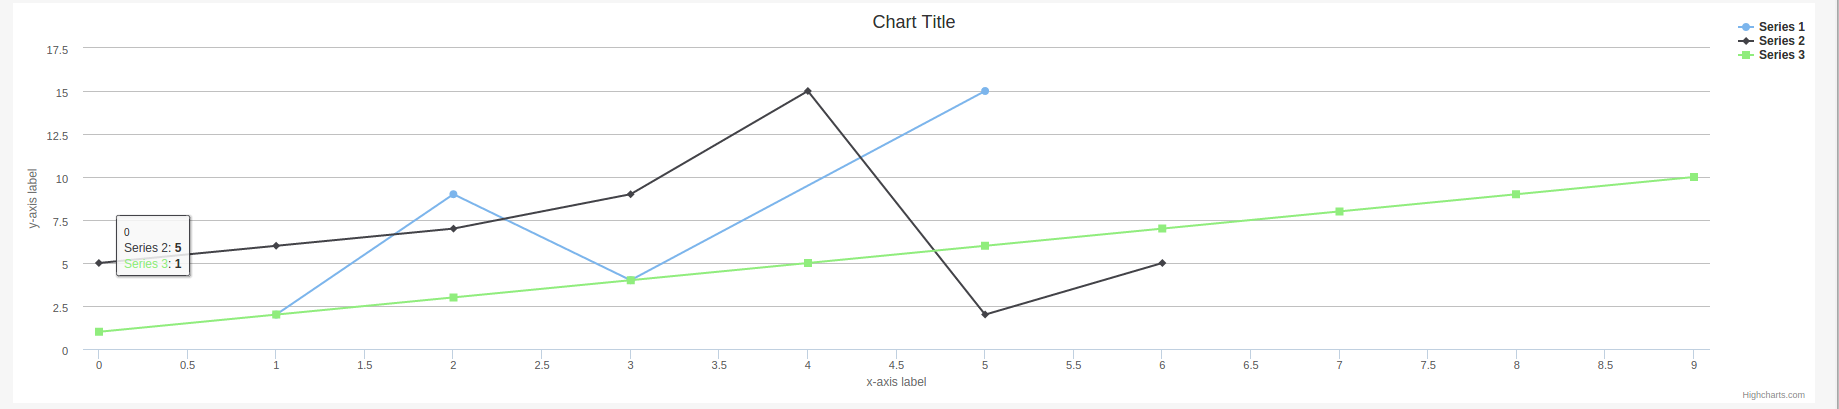
You can see how convenient this can be.
The Chart object can also be used for accessing all data points which can be useful for functional testing.
Note/Reference –
- Highcharts is free for non-commercial use only.