Sysdig has been one of the most advanced cloud-based tools for monitoring your infrastructure. So, talking about Docker monitoring, Sysdig gives us a lot of insights about our containers, few of which we will be talking about in this blog. Docker is the most widely used and trending tool when it comes to DevOps.
USE-CASE
In this use-case we had to monitor Docker containers for an e-commerce web application. We had to find the tool which gives us all insights of the Docker containers. Sysdig was the next tool in our list of tools and technologies that we are using at TO THE NEW Digital. I have a container running on my host machine and apache2 service running inside it. Let’s monitor this container.
INSTALLATION STEPS:
Create a Sysdig account from this URL: https://sysdig.com/docker-monitoring/ . You will get a confirmation mail from Sysdig. Click on the activate button, this will redirect you to the Sysdig page where you can further complete your registration. After that click on next, which will take you to the below page:
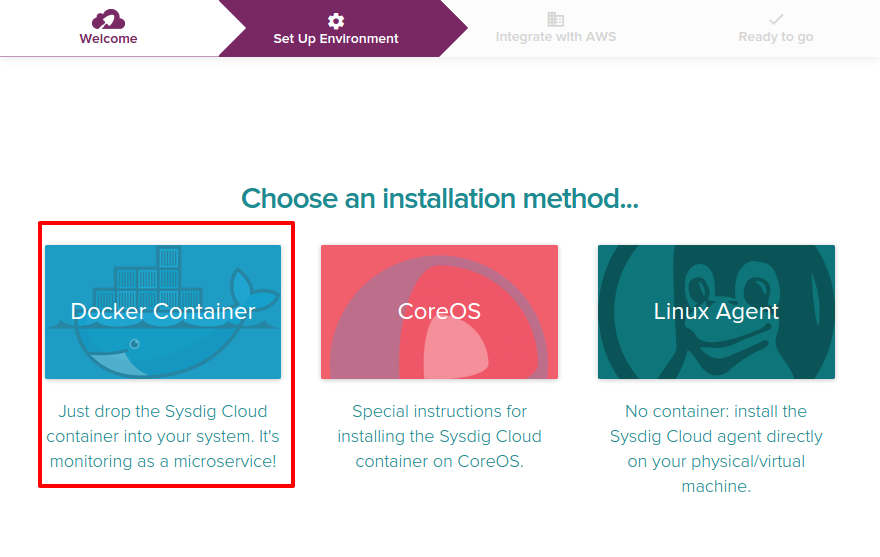
Select Docker Container here which will open a page where installation steps will be mentioned:
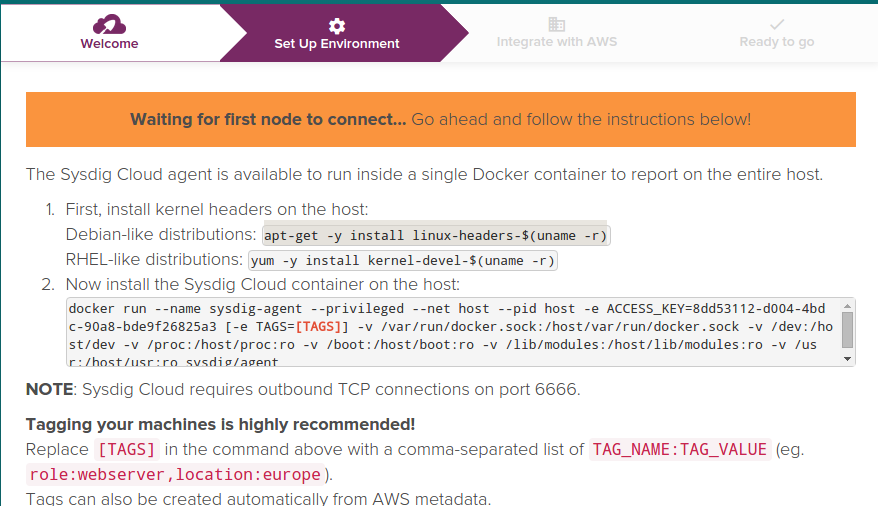
Above commands can be run on your host machine. It is account dependent so the ACCESS_KEY will be different. You can replace [TAGS] option as specified in the above image. I have run the second command on my host machine using -itd switch. Else the container will run interactively and will print all lines on the terminal. Also, I have not used the TAGS switch. The command will now look like:
[js]
docker run -itd –name sysdig-agent –privileged –net host –pid host -e ACCESS_KEY=8dd53112-d004-4bdc-90a8-bde9f26825a3 -v /var/run/docker.sock:/host/var/run/docker.sock -v /dev:/host/dev -v /proc:/host/proc:ro -v /boot:/host/boot:ro -v /lib/modules:/host/lib/modules:ro -v /usr:/host/usr:ro sysdig/agent
[/js]
After this it should say:
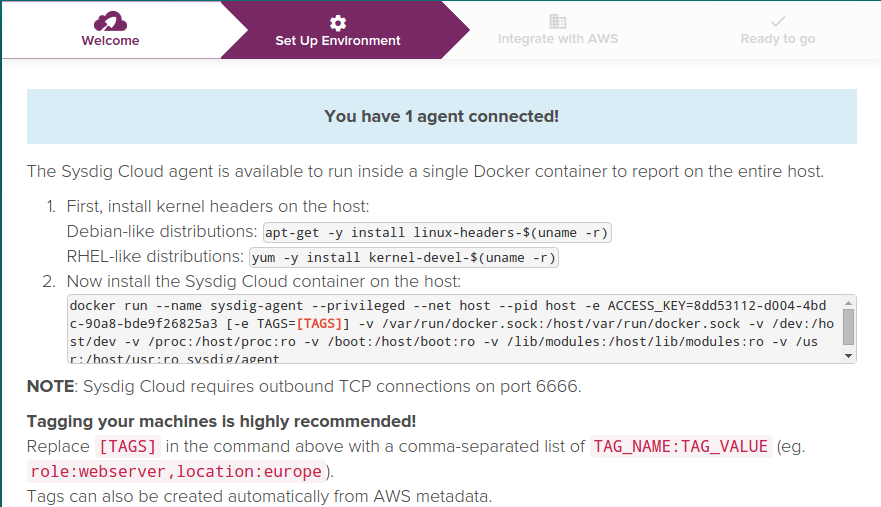
Just click on Next and it should take you to the Integrate with AWS page:
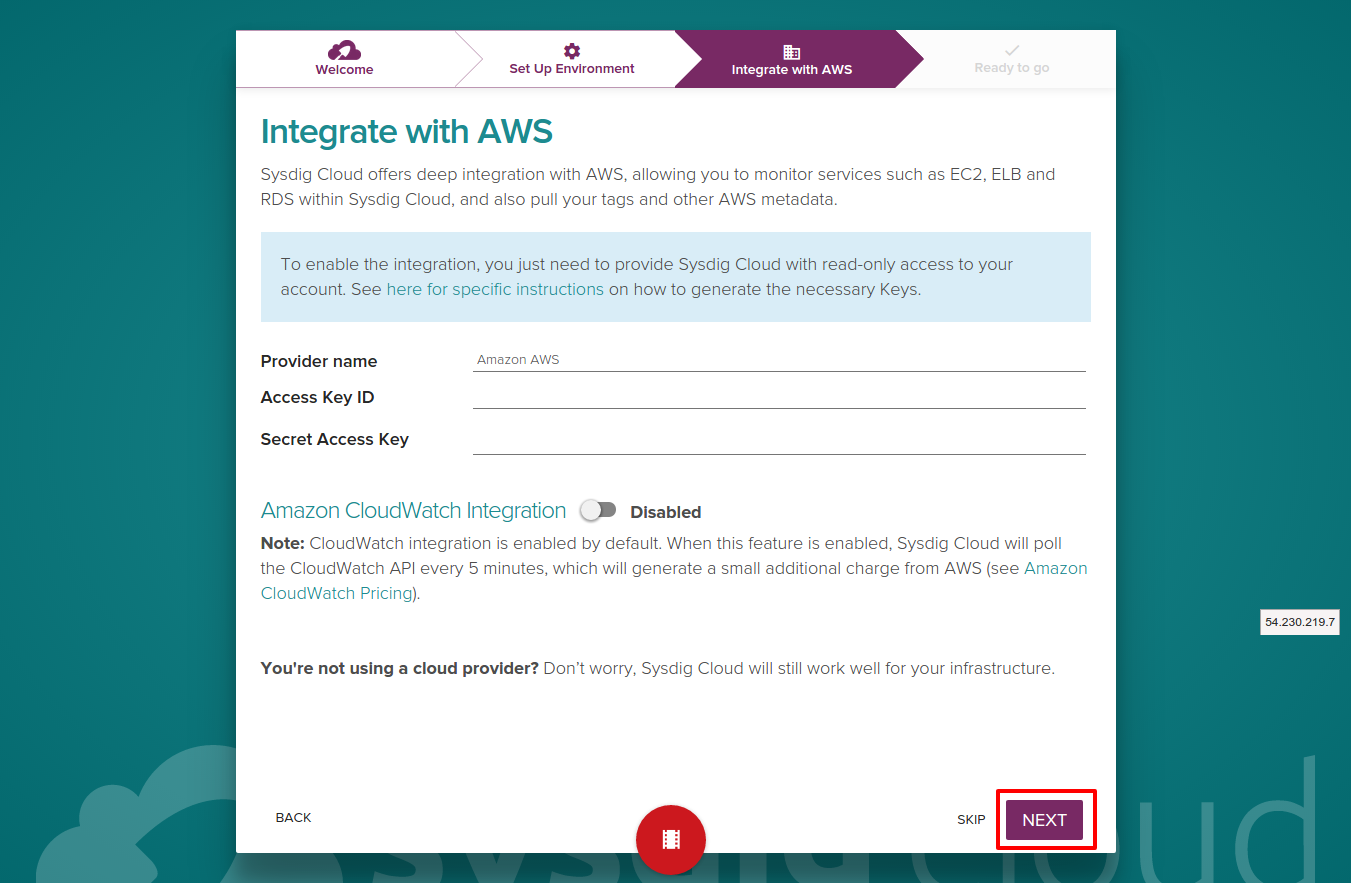
If you want any integration with AWS account go ahead and give read access to Sysdig. You can create an IAM user, attach a READ ONLY policy to the user and enter the credentials here. Since, I am just concerned about the Docker monitoring, so will skip this step clicking on SKIP.
After this is should say:
MONITORING
Let’s Head onto the Console to see what we have got.
Select Explore and it will show you the following options as in the image below:
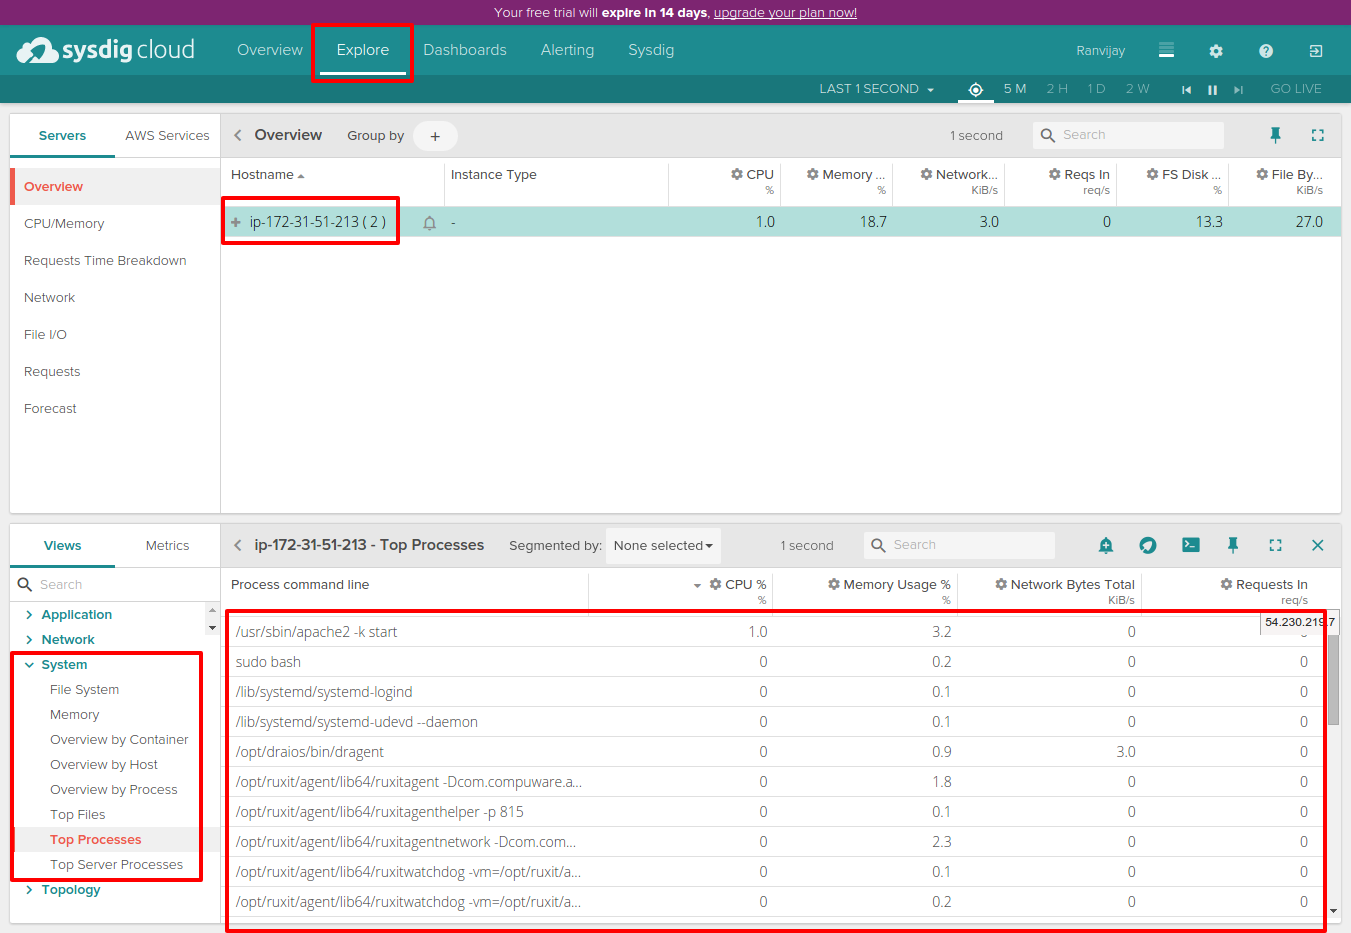
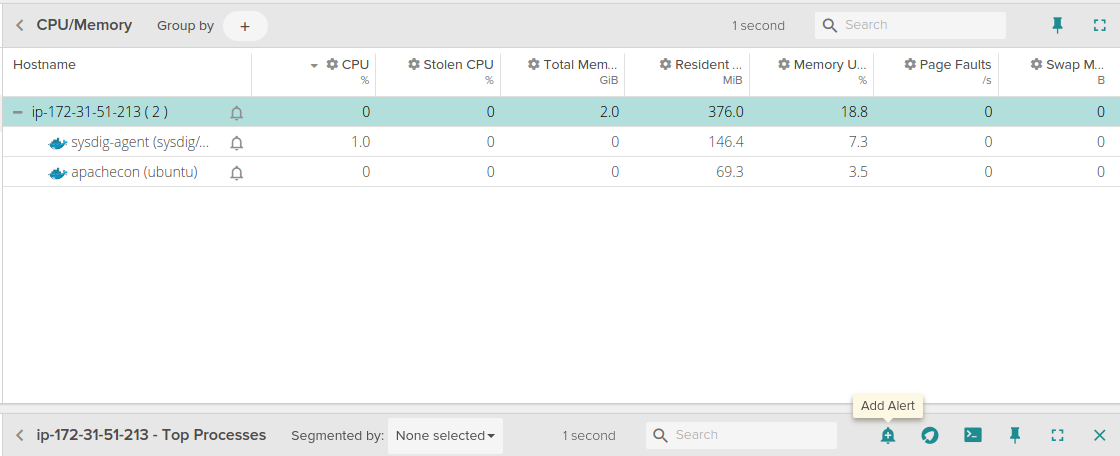
It will show you the host machine with a “+” sign before it. If you select the host machine, it will give you insights of the host machine. I have selected System -> Top Processes and it is showing me all the top processes running on my host machine. You can select any other option from the left hand-side. An important phase of any Devops project is Docker monitoring. For that just click on the “+” sign adjacent to the host machine’s hostname. It should show something like below:
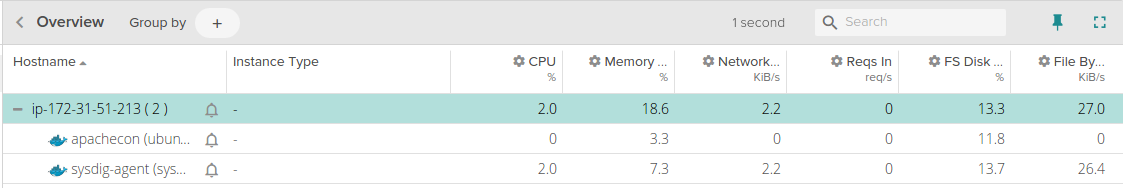
So, it has listed both the Docker containers as in the above image. One of them is the sysdig-agent container which is giving us all the insights. Now, we shall select the apachecon container and see what insights we have. Also, in the bottom left I have selected Container Overview and it will give you an overall view of metrics related to the container:
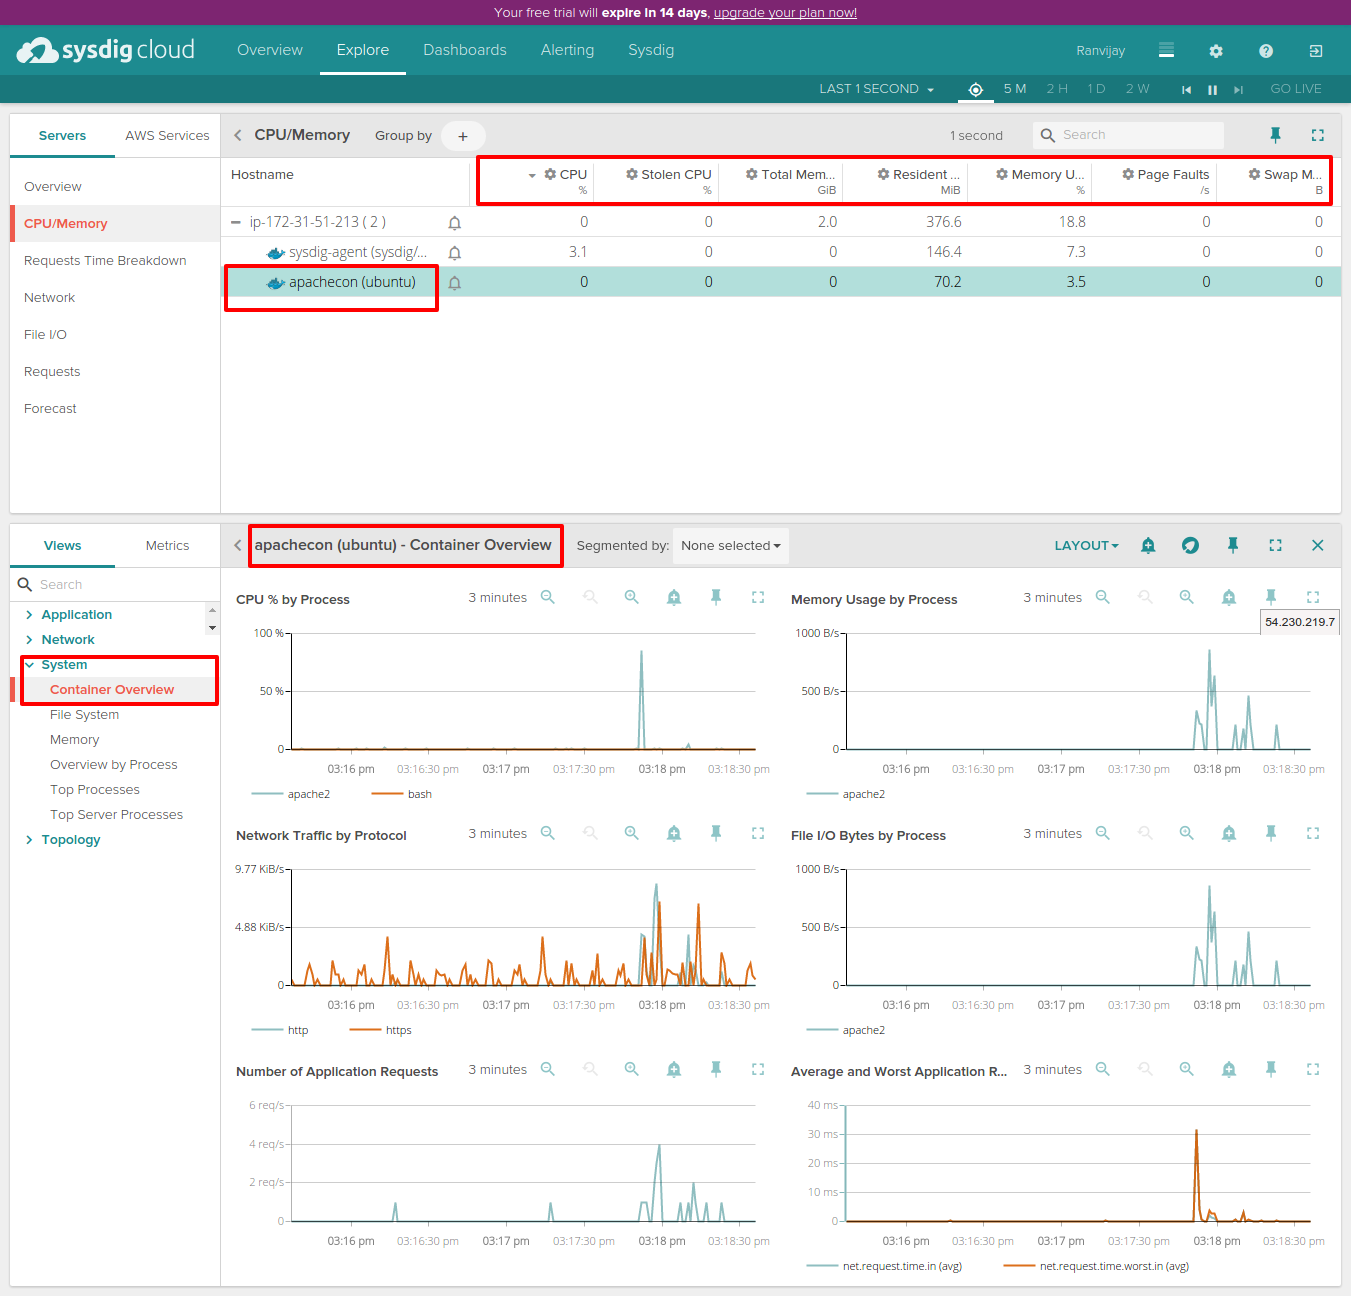
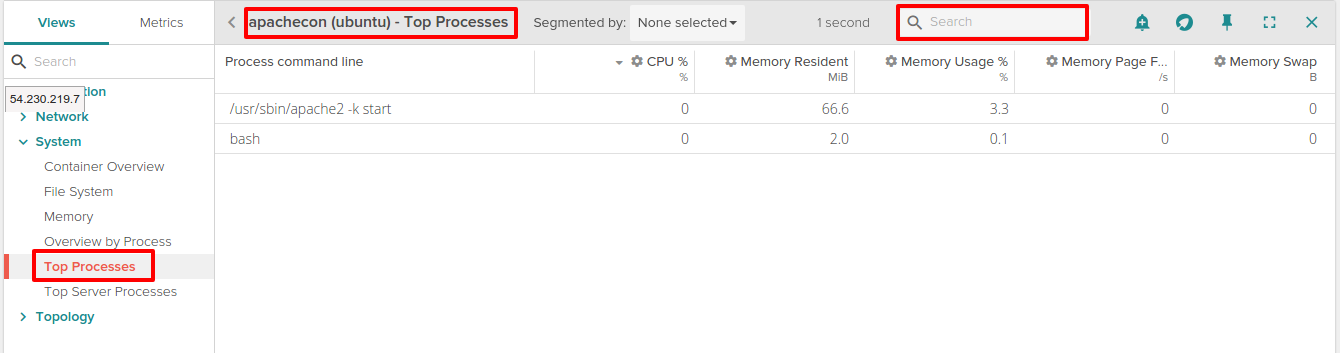
You can select Top Processes to see the top processes running inside your Docker container. Also, you can then search by process name if there are a lot of processes running.
ALERTING
Let’s see what type of alerts can we put.
What we are looking for is monitoring of Docker related things. Select on alert icon there “Add Alert”:
After clicking on the above it should open something like:
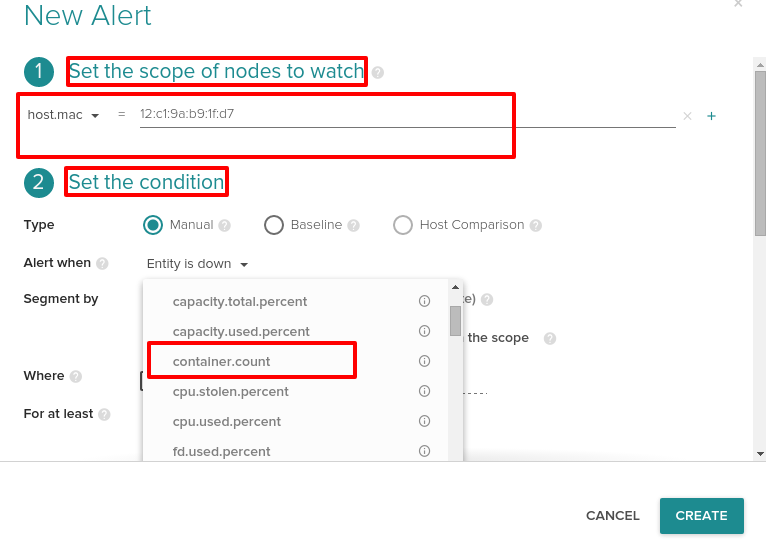
It gives you 4 main topics inside which you can choose some options. Two of them are in the above image. Choosing the metrics depends on the use-case. You can choose metrics like cpu, memory etc. We would be interested in the Docker part of the alerting.One of the options which is Entity is Down can be put to containers too and other such metric that Sysdig gives us is Container Count.
[js]container.count
Count of the number of containers. [/js]
After choosing container.count we have some more options to choose from like:
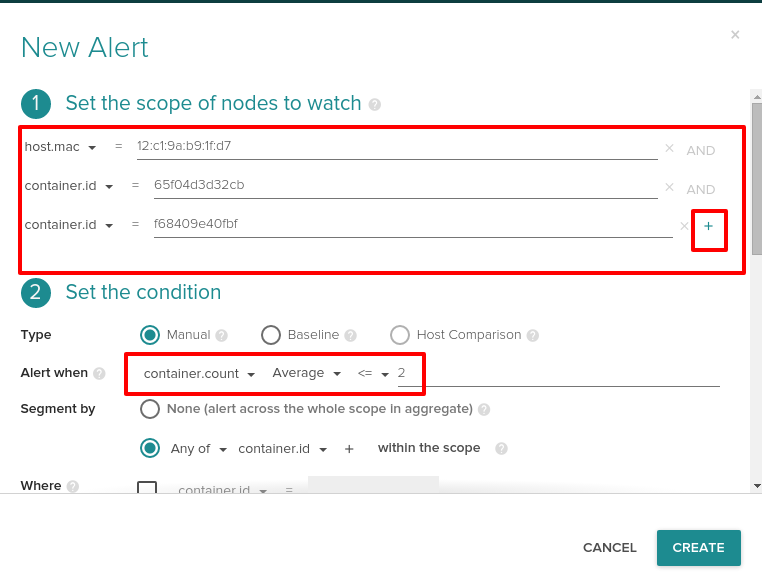
I have added the container IDs in the scope as well using the “+” sign in the scope. Now, I have selected the condition if Average count <= 2 i.e. average count of containers on my host machine don’t fall in this condition it should alert me. I have selected 2 here because I have only 2 containers running on my host machine. I want to be alerted if the containers count reduces. The next two options Topics are as below and are easy to understand:
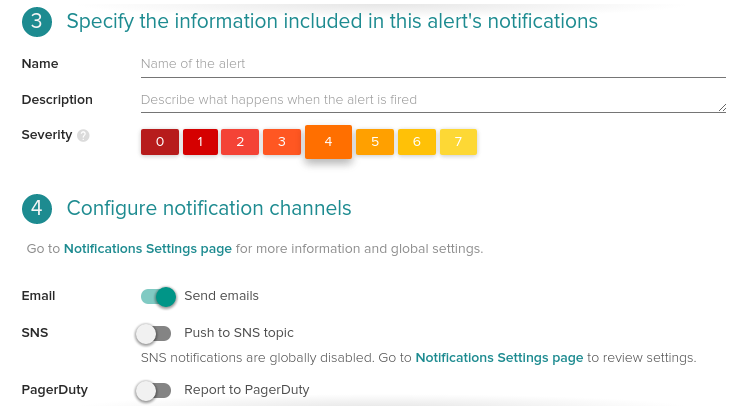
After you are done just select on CREATE as shown in an earlier image.
Now, you can put on individual containers.
Select the container this time and click on the Add Alert button as we did in the previous step. It will again open something like this:
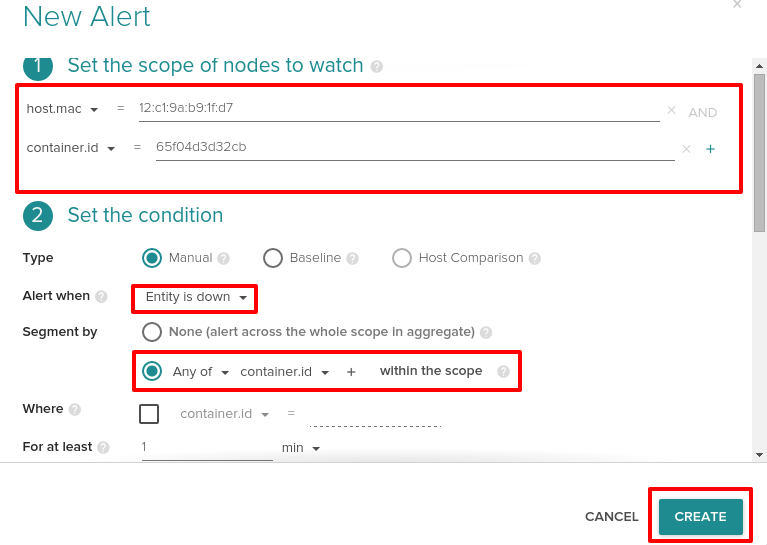
It will already have the container ID in the scope. Now, I can monitor if my Docker container is down. I can go go ahead and choose Entity is Down and set an alert for that. If containers within the scope are down I will be alerted. Also, I can now get all insights of my Docker containers.
I personally found Sysdig a good way to monitor my Docker containers. I will be working with more Docker tools. Stay tuned for my new blogs.