Monitoring your Docker containers using Ruxit
Docker monitoring is very important when it comes to using Docker. In my last blog, I talked about how we can monitor the status of a Docker container using a bash script and AWS CloudWatch. In this blog, I will be telling you how to get insights of your Docker container using a tool called Ruxit.

Ruxit is a tool that I found as I was browsing through web pages to find the best monitoring tool for Docker. It gives you deep insights of what is running inside your containers and how the services are performing. Also, what resources are being used by those containers?
Use-case
I had to find a way to monitor my Docker containers. I decided to do the monitoring by using the Ruxit tool. I will show you how to install the Ruxit agent on your Docker host machine and then see what all insights we can get.
Prerequisites
1. Docker installed on your linux host machine.
2. A live Docker container running any application server via any web server.
Steps
1. Installing Ruxit:
Login to your Ruxit account after creating an account at www.ruxit.com
You will see a screen like below:
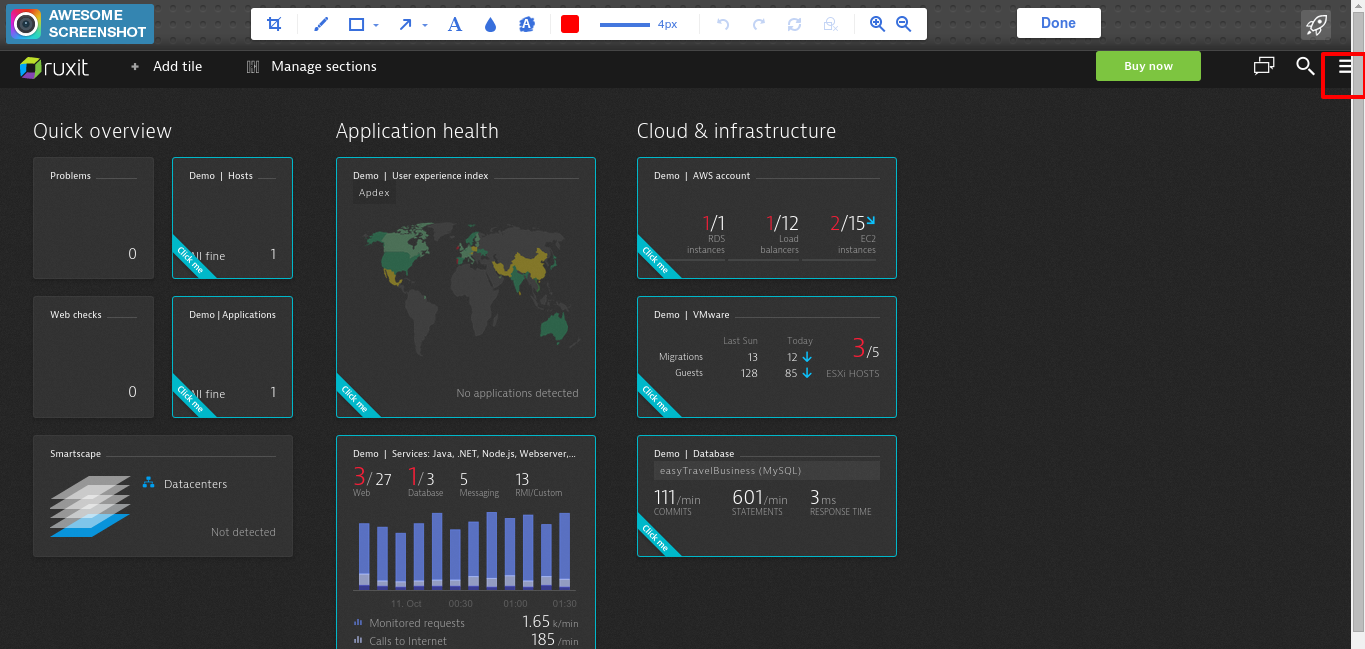
On the right top corner, you will see a menu button, the one I have highlighted. Click on that and it should open something like:
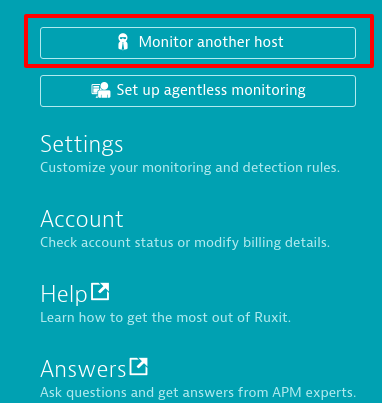
Now, click on Monitor another host and it will take you to a page as shown in the below image:
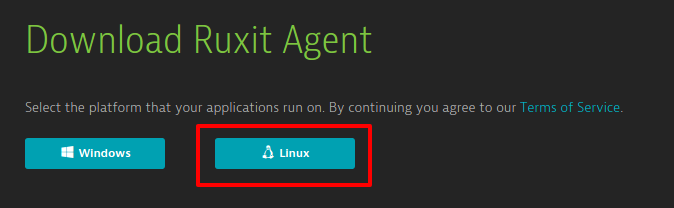
Go ahead and choose Linux to move ahead to the below shown page:
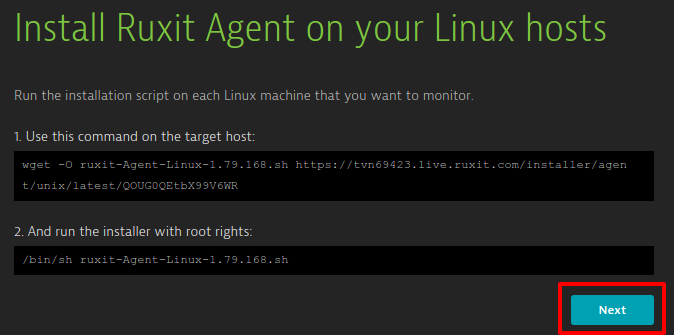
Just copy the first command and run it on your host machine. Similarly, run the second command on your host machine and press Next.
2. Using Ruxit:
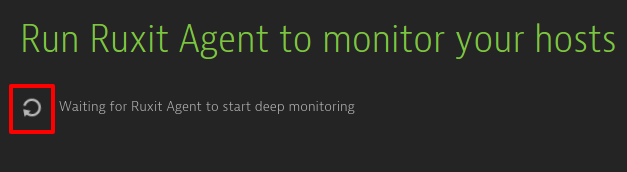
The above shall start Ruxit agent on your host machine. It will return a URL as well. Now, just hit that URL in your browser. It will take you to the Ruxit Dashboard and show you your containers:
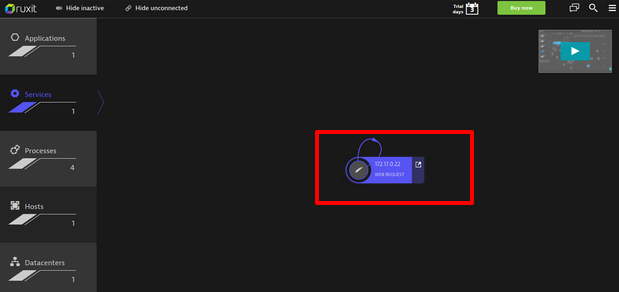
The object in the red box is the container. I have one container running on my host machine. And the container IP is shown. If I click on the icon it will expand and show what is running inside my Docker container:
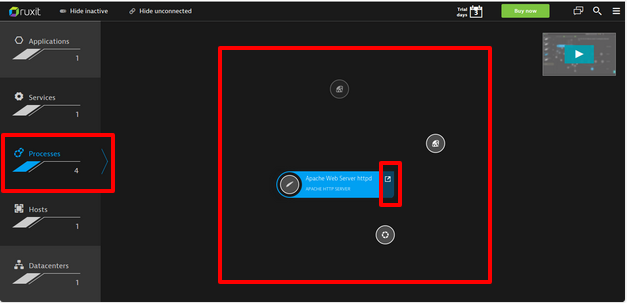
It shows 4 processes running inside the container. In my case, the main process in Apache Web Server httpd since my container is CentOS based. Other services installed are sendmail etc.
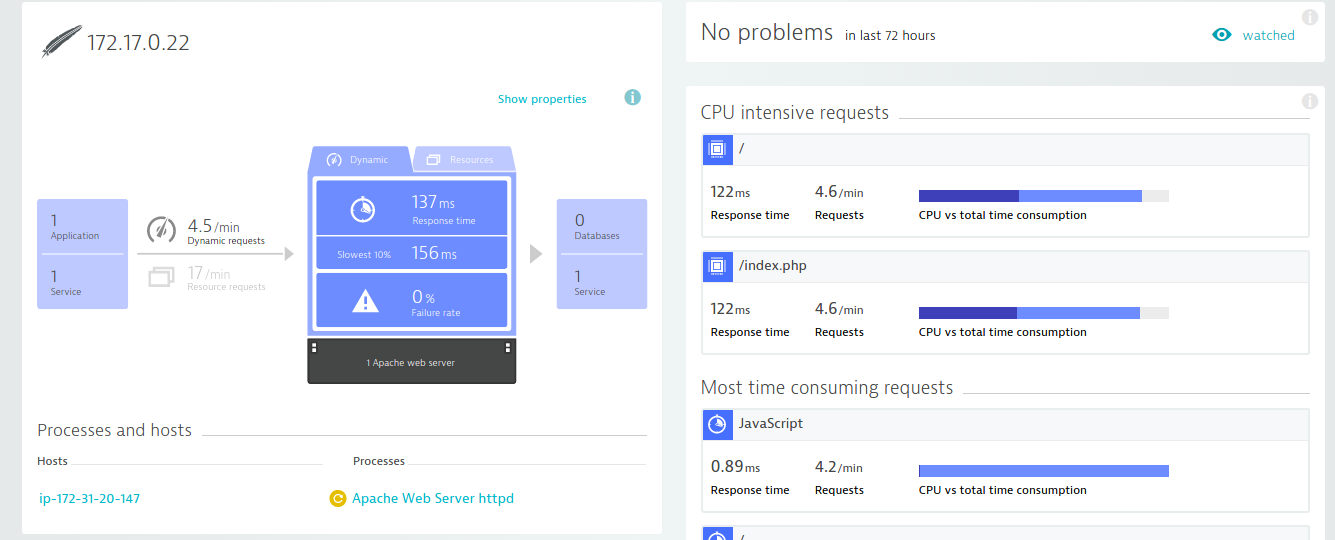
Now, just click on the button next to the text “Apache Web Server httpd” which has a small arrow present there. It should open the following:
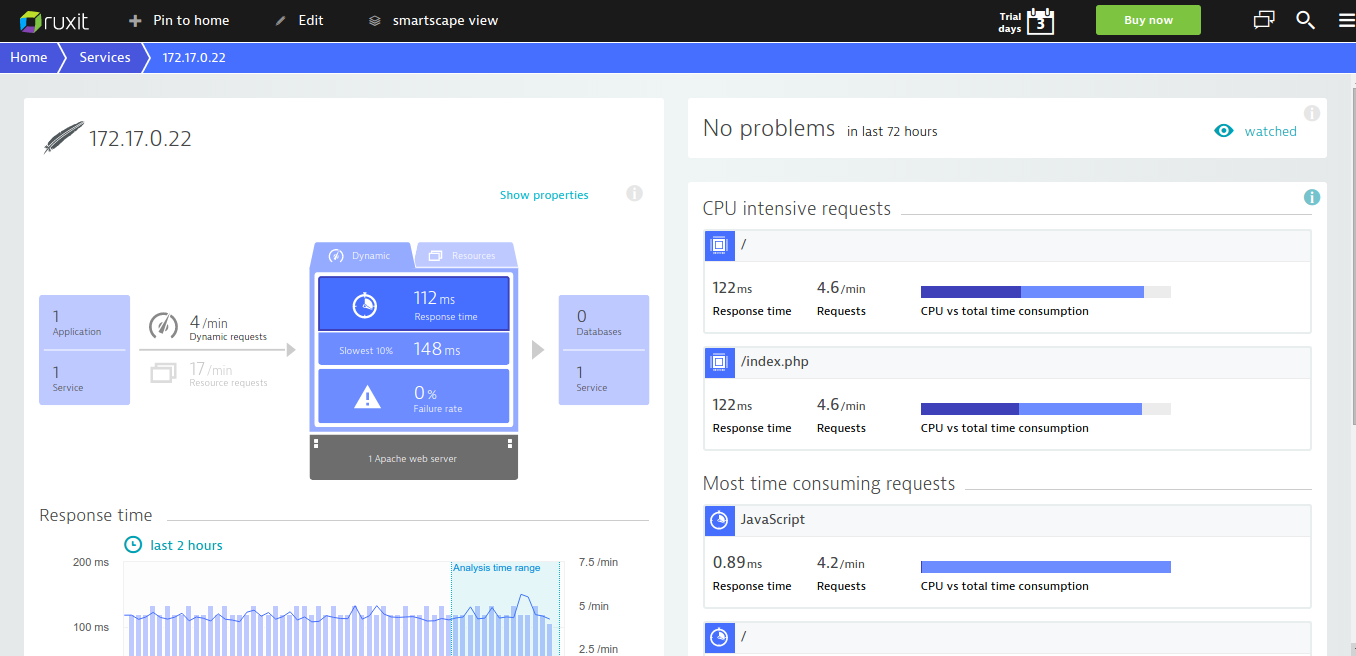
You can view the following stats as shown in the above image.:
- Response time
- Slowest response time
- Dynamic Reports
- Resources reports
- Graphs for respective metrics
- On the right-hand side, you will see other stats like:
- CPU-intensive requests
- requests at / location of the website
- Time for JS to load etc.
There is a wide range of stats you can see here. If you scroll down you can see many graphs on the left:
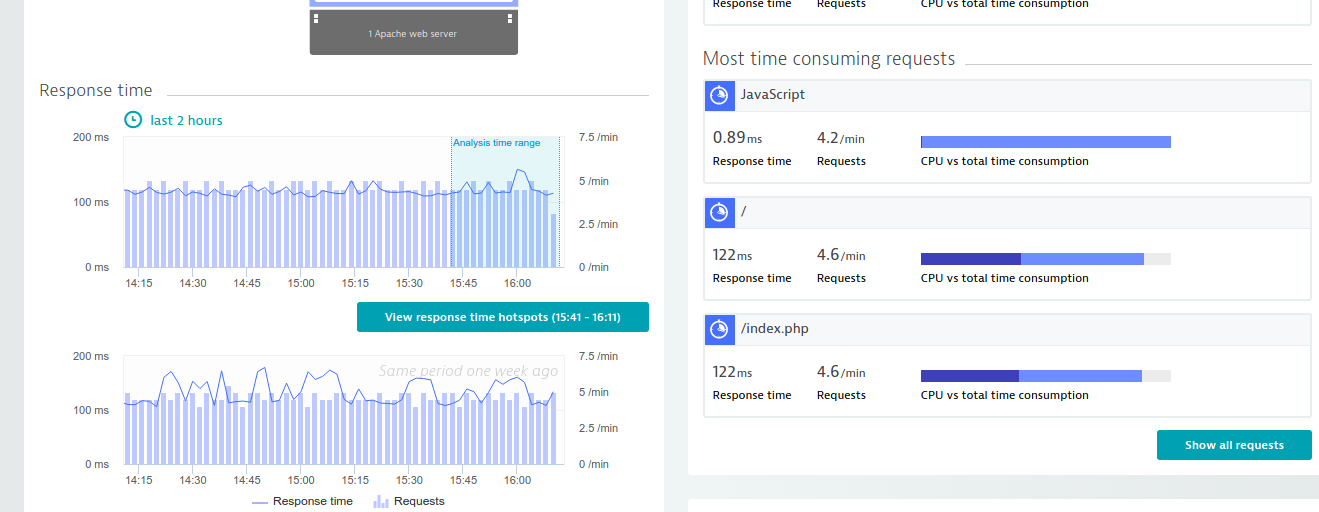
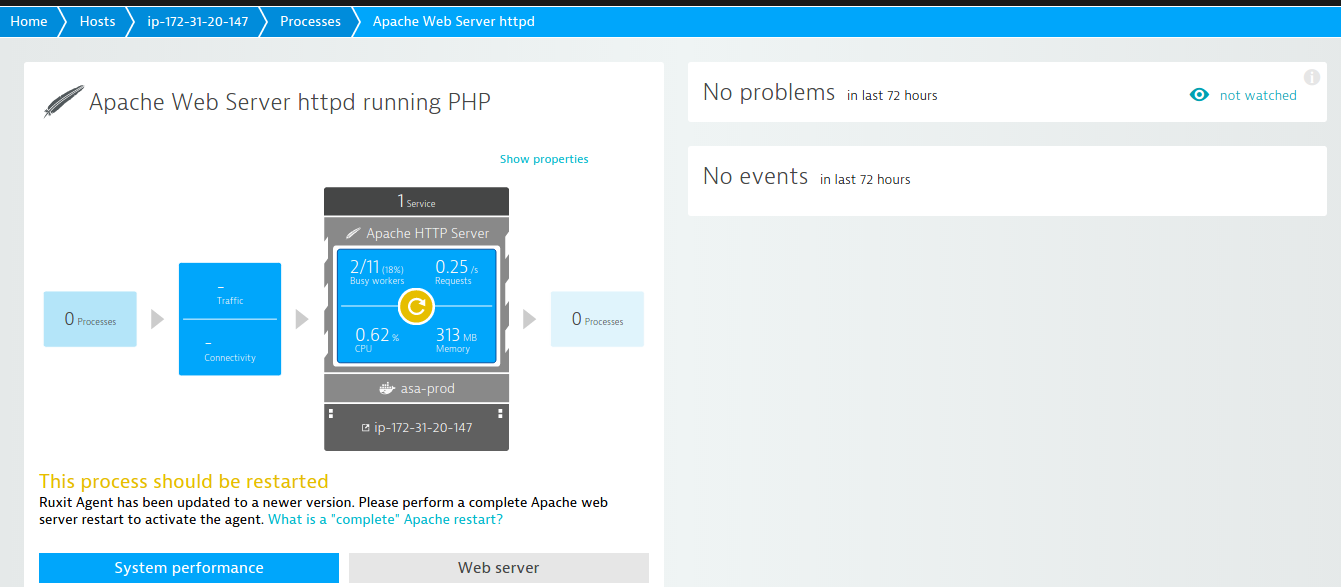
A few more details can be looked at by clicking Apache web server:
It will take you to the following page giving you more insights:
System performance can also be analysed:
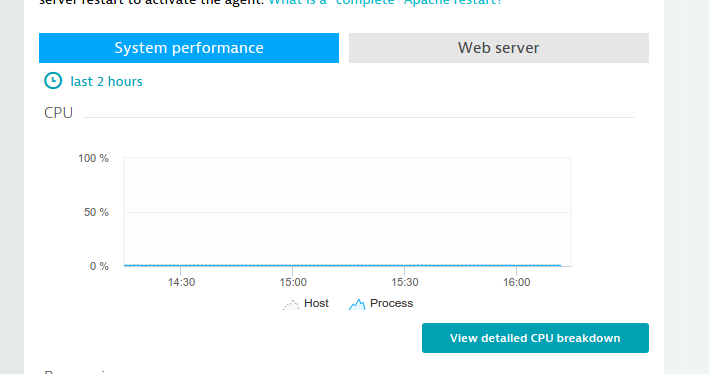
Now, click on Web server to get insights like:
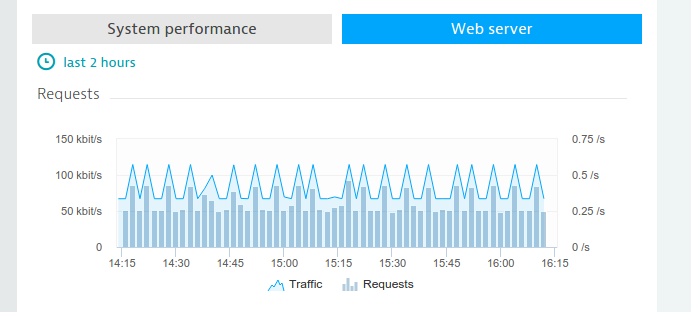
So, that’s what you can do using the Ruxit monitoring tool for Docker. You can monitor any number of Docker containers. Ruxit will be adding more functionalities soon. Be tuned into my blogs and follow me on twitter @ranvijayj