Zabbix is an Open source distributed monitoring tool. It allows us to monitor integrity and health of the server, network traffic, and applications. Zabbix uses a notification mechanism that allows users to configure e-mail based alerts for virtually any event.
![]()
Components Used in Zabbix are as follows:
- Zabbix Server : This is the central component that receives all the monitoring report and statistics. Zabbix server provides a web interface to present reports and statistics, as well as configure parameters.
- Database Storage : All the configuration information, as well as monitoring data gathered, is stored in a database.
- Zabbix Agent : Zabbix agent is a software that is deployed on the target machine that needs to be monitored. It is responsible for reporting the gathered data from the target to Zabbix Server.
Zabbix Server Installation
Prerequisites:
- Mysql 5.3.0 or above
To install Zabbix Server in CentOs, follow the steps:
- Install Zabbix Server. By default httpd server is installed with Zabbix for hosting php code of Zabbix server UI. Zabbix server runs on 10051 port:
[js]
yum install epel-release
rpm –import http://repo.zabbix.com/RPM-GPG-KEY-ZABBIX
rpm -Uv http://repo.zabbix.com/zabbix/2.4/rhel/7/x86_64/zabbix-release-2.4-1.el7.noarch.rpm
yum install zabbix-server-mysql zabbix-web-mysql
[/js]
- Edit the Zabbix configuration file using the following command:
[js]
vi /etc/httpd/conf.d/zabbix.conf
[/js]
Update the timezone parameter in the file:
[js]
php_value date.timezone Asia/Kolkata
[/js]
- Restart the httpd server:
[js]
systemctl restart httpd
[/js]
- Create Database and user for Zabbix:
[js]
mysql -u root -p
mysql > create database zabbixdb character set utf8;
mysql > grant all privileges on zabbixdb.* to ‘zabbixuser’@’localhost’ identified by ‘your_password’;
mysql > flush privileges;
mysql > exit
[/js]
- Import Zabbix Schema and data to zabbixdb:
[js]
mysql -u zabbixuser -p zabbixdb < /usr/share/doc/zabbix-server-mysql 2.4.5/create/schema.sql
mysql -u zabbixuser -p zabbixdb < /usr/share/doc/zabbix-server-mysql-2.4.5/create/images.sql
mysql -u zabbixuser -p zabbixdb < /usr/share/doc/zabbix-server-mysql-2.4.5/create/data.sql
[/js]
- Edit Database configuration in zabbix_server.conf:
[js]
vi /etc/zabbix/zabbix_server.conf
[/js]
Update the following parameters:
[js]
DBName=zabbixdb
DBUser=zabbixuser
DBPassword=your_password
[/js]
- Edit PHP configuration for Zabbix frontend:
[js]
vi /etc/php.ini
[/js]
Update the following parameters in file :
[js]
max_execution_time = 600
max_input_time = 600
memory_limit = 256M
post_max_size = 32M
upload_max_filesize = 16M
date.timezone = Asia/Kolkata
[/js]
- Make sure that either SELinux is disabled or apache is configured to communicate with Zabbix in SELinux.
- Now, start Zabbix and httpd server using below commands:
[js]
systemctl start zabbix-server
systemctl restart httpd
[/js]
Configuring Server through Web UI
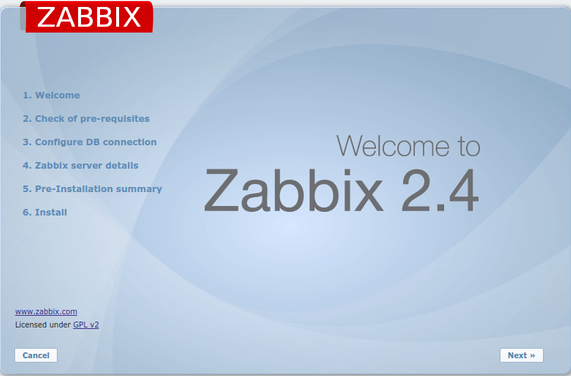
1. Open the browser and navigate to Zabbix_Server_ip/Zabbix:
2. On clicking Next, you will be taken to prerequisites window. It displays information about the softwares that are required by Zabbix Server:
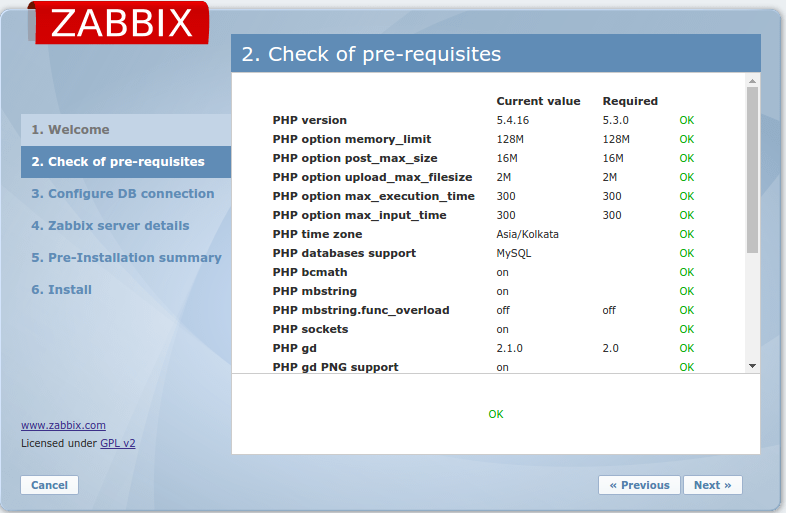
3. Verify the version of software installed in the Server and Press Next to Continue:
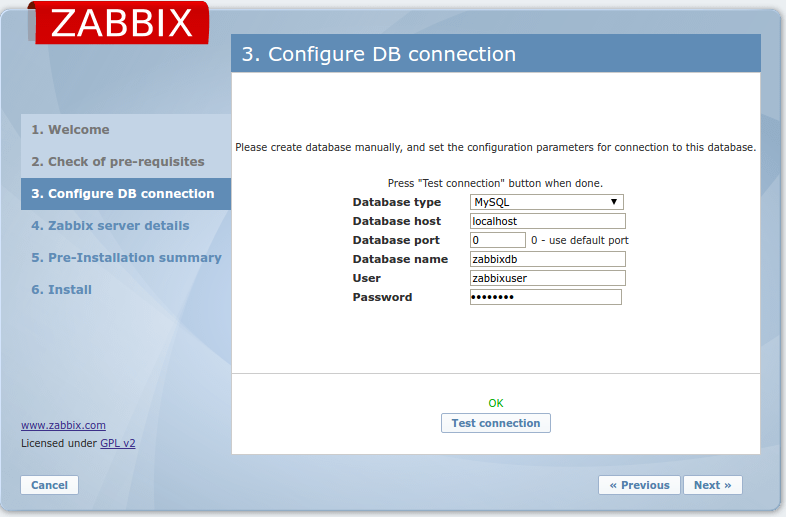
4. Enter the Database Name, Database user, and password and Test the connection. Press Next to continue:
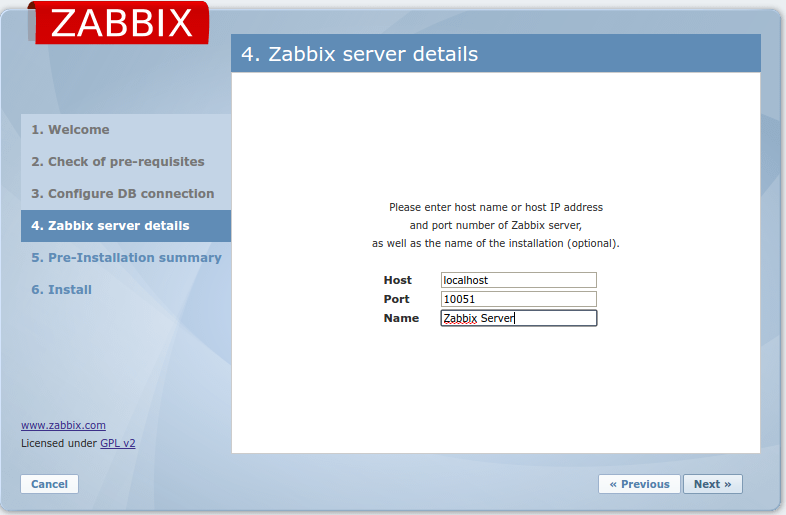
5. Enter Server Name and port and then Click Next:
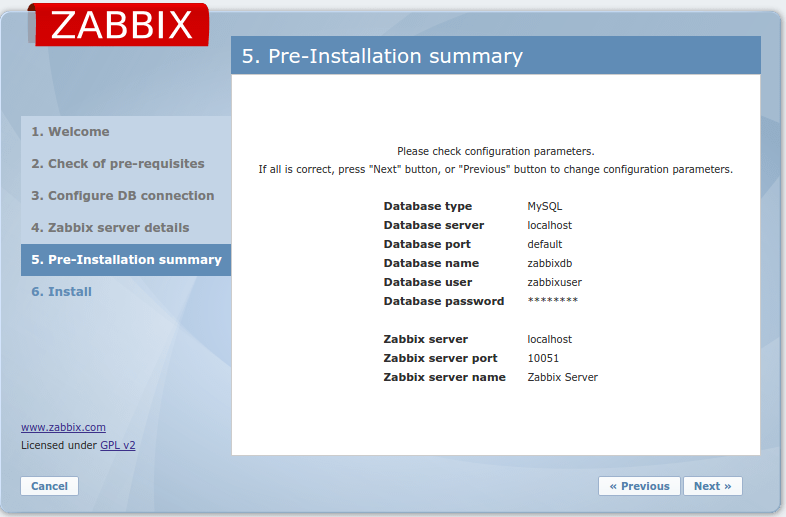
6. Re-check the configuration parameter and Press Next:
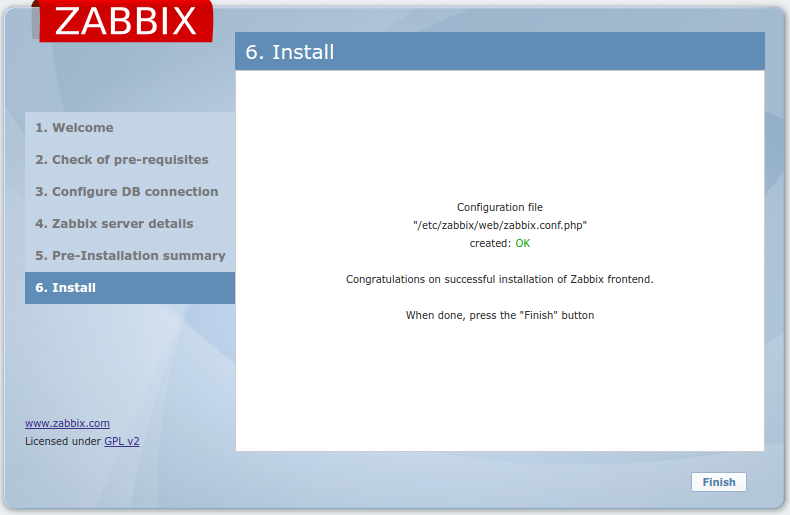
Congratulation, you have successfully installed Zabbix Server. Click on finish to login to Zabbix server:
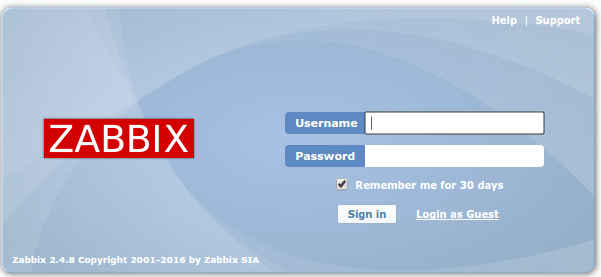
7. The default username and password is admin and zabbix respectively.
Zabbix Agent Installation
To Install Zabbix agent in CentOs, follow the steps:
- Install Zabbix agent on the target machine:
[js]
rpm –import http://repo.zabbix.com/RPM-GPG-KEY-ZABBIX
rpm -Uv http://repo.zabbix.com/zabbix/2.4/rhel/7/x86_64/zabbix-release-2.4-1.el7.noarch.rpm
yum install zabbix-agent -y
[/js]
- Update Zabbix Client Configuration file:
[js]
sudo vi /etc/zabbix/zabbix_agentd.conf
[/js]
Update the following parameters in the file:
[js]
Server=Zabbix_Server_ip
ActiveServer=Zabbix_Server_ip
Hostname=hostname_of_target_host
[/js]
- Now, start Zabbix Agent using following command:
[js]
systemctl start zabbix-agent
[/js]
Now, it’s time to add monitoring/target host on Zabbix Server
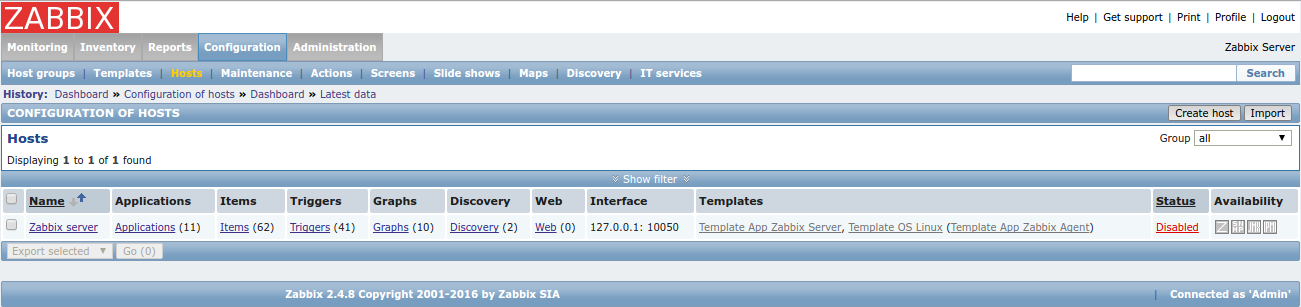
- Open Zabbix Server Web UI and Navigate to Configuration -> hosts and Click on create hosts:
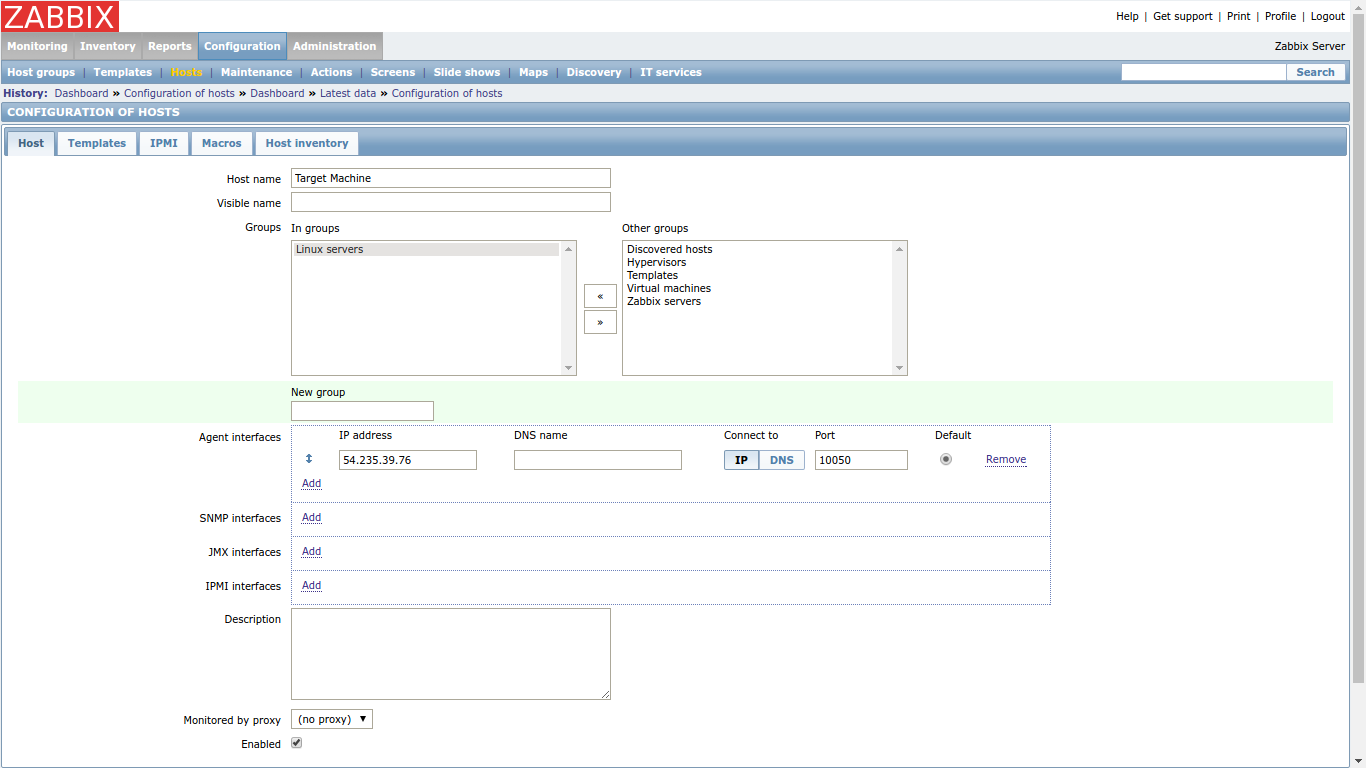
- Provide Hostname, group and IP of the target machine. A group is a collection of related hosts. You can create new groups from Configuration -> Host groups -> create group.
- Click on template Tab and select a template from default templates provided by Zabbix Server. Template is used to group items. Items are the basis of gathering data in Zabbix. An item defines a single metric. We can also create custom items and templates.
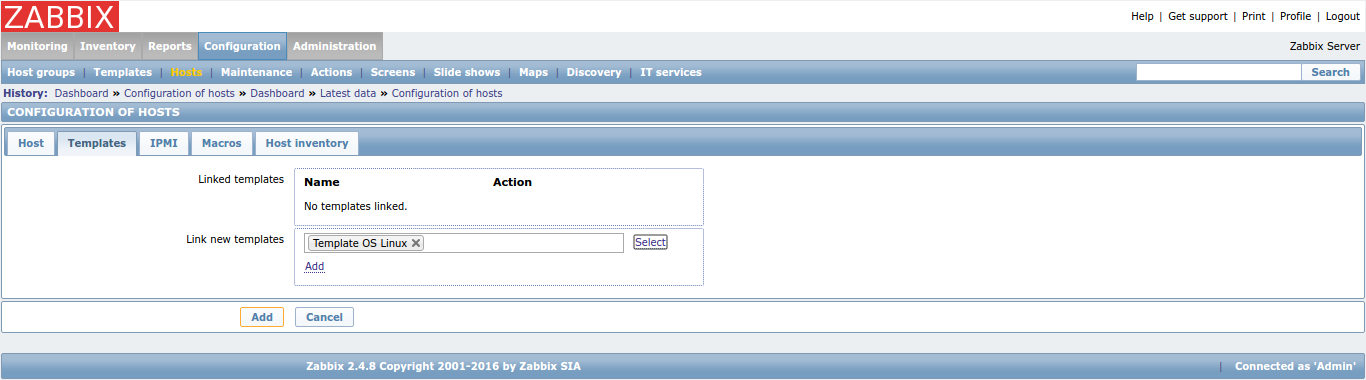
- Click on Add to attach the template to host and then press Add to add the host for monitoring.
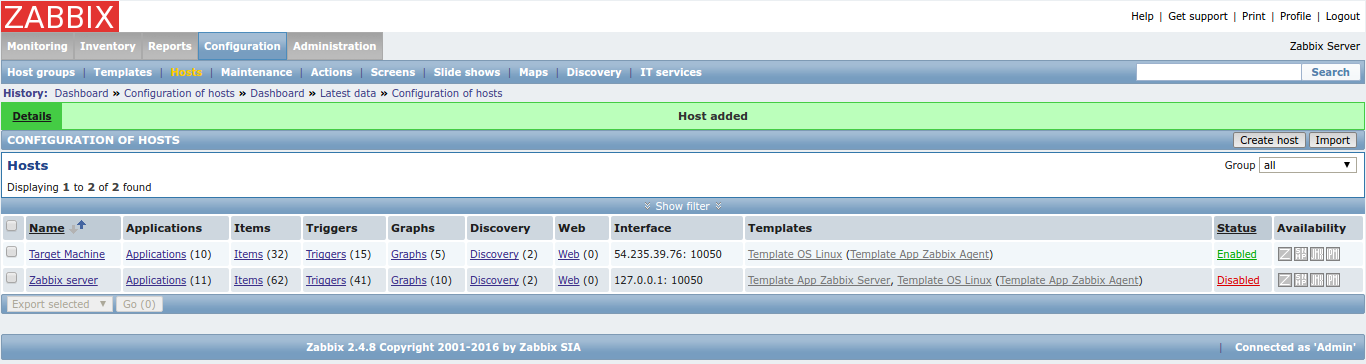
Congratulations!
You have configured a host for monitoring.
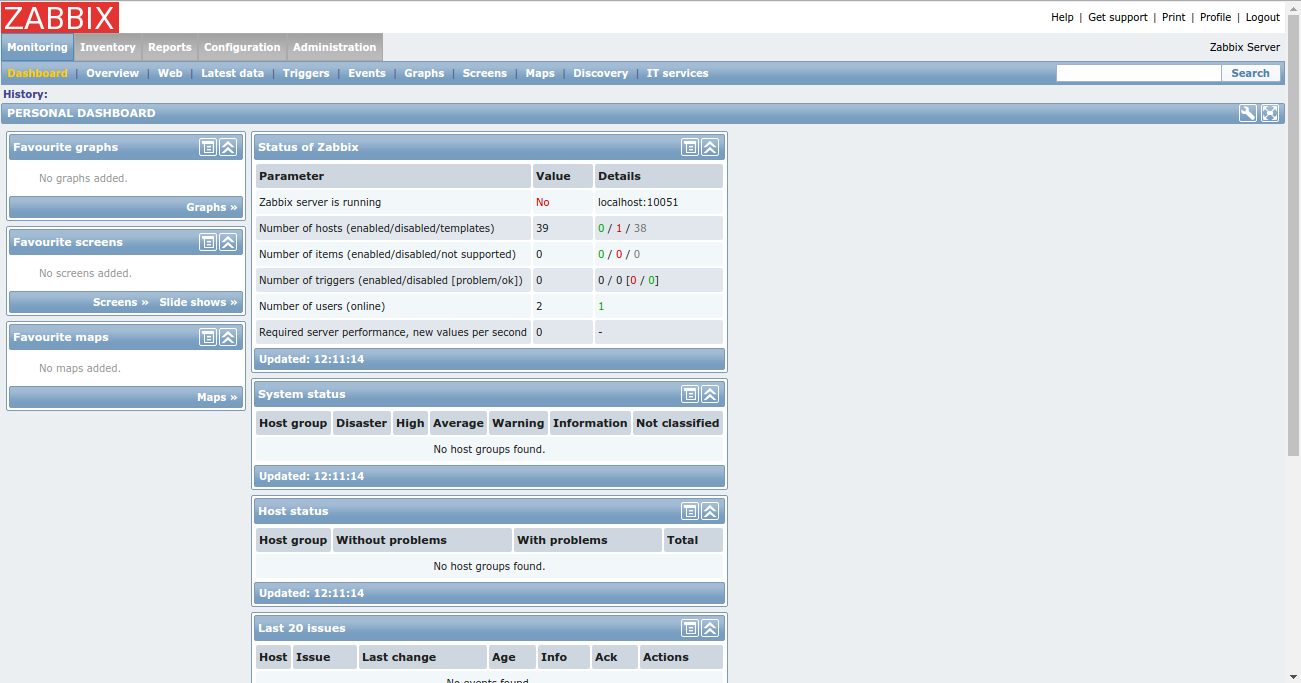
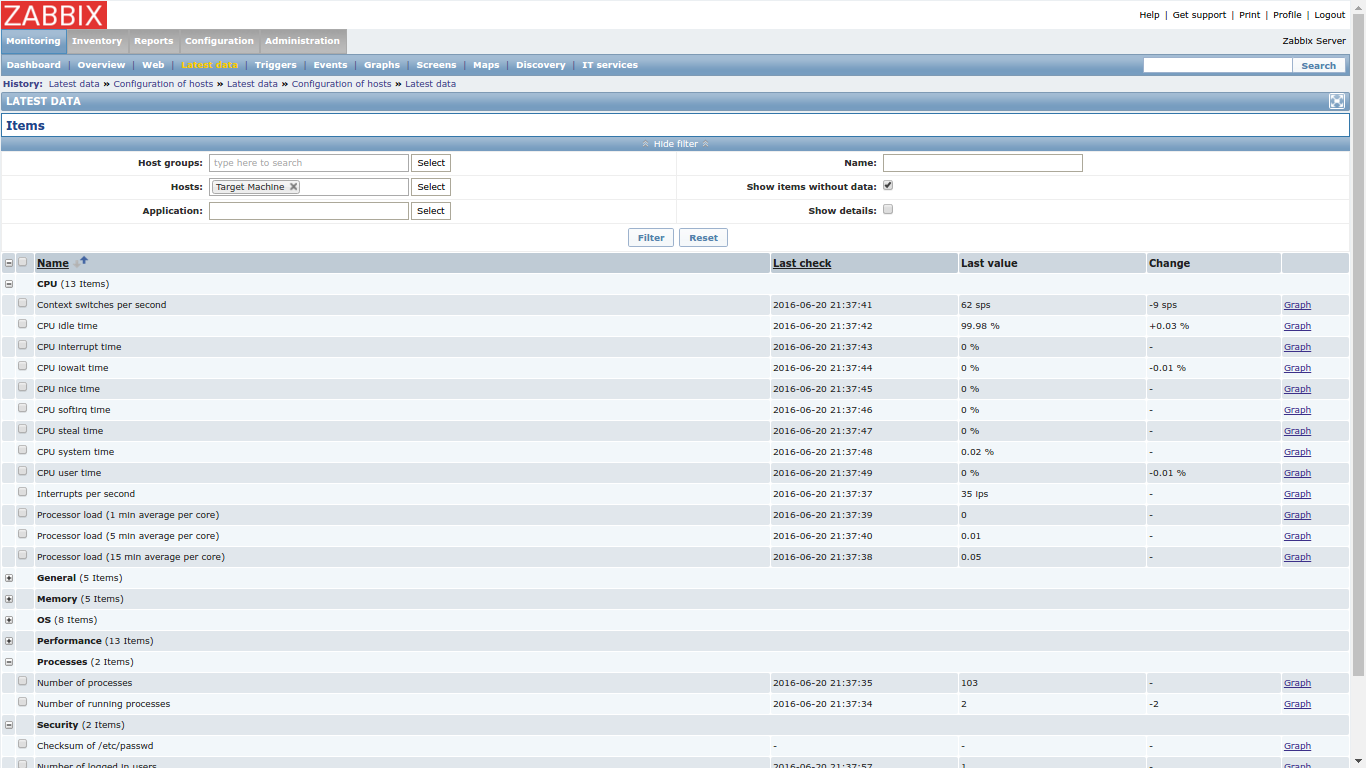
- Now navigate to Monitoring -> Latest Data to view monitoring information:
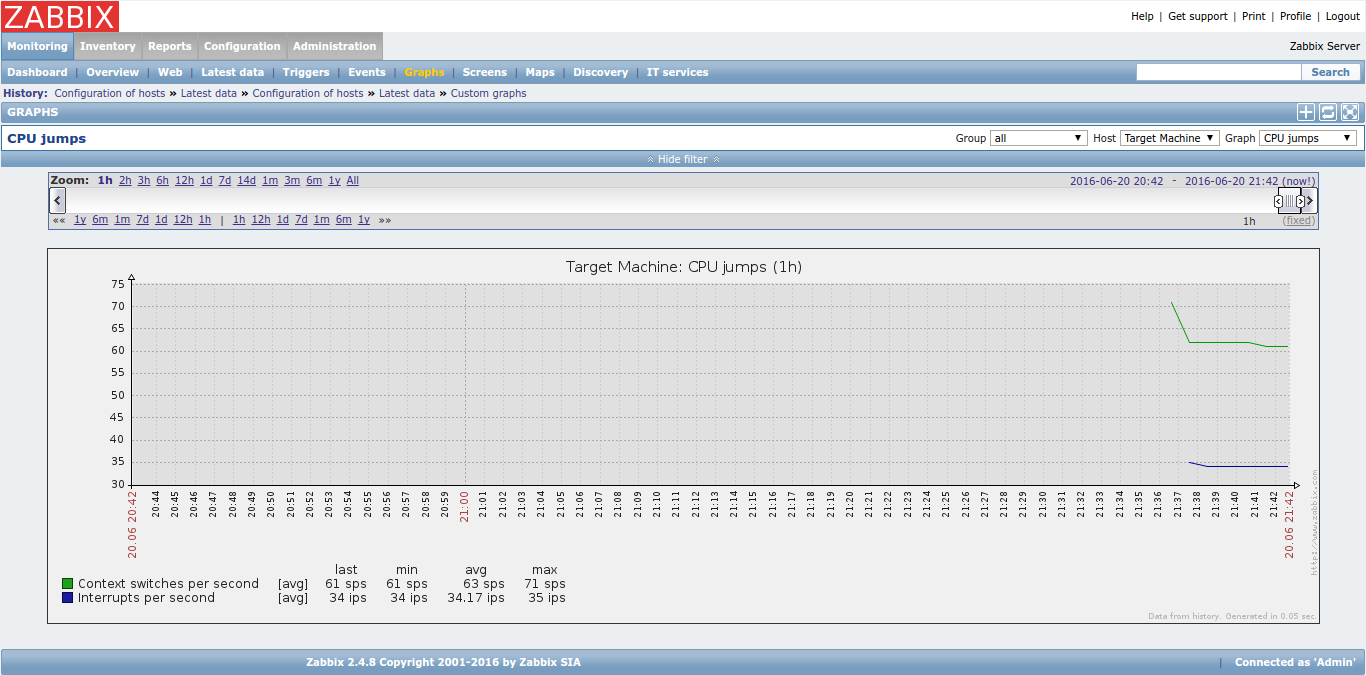
- To view information in graphical format, navigate to Monitoring -> graphs, select the host and graph metric from the drop down menu:
Zabbix is an amazing open source monitoring tool which can also be used to monitor network traffic, to create a custom metric, perform web application monitoring and trigger alarm when system deviate from its usual behavior.
I hope it helps. In my next blog, we will learn how to create a custom metric and trigger the respective alarm.