1. Introduction
With the increase in mobile users, customers are contacting businesses through a variety of channels, including social media sites, review websites, email, and live chats at any time of day, which increases the number of requests and complaints generated. When a problem or support request arrives at the ITSM Ticketing tool, it must first be processed, categorised, and given priority. These tickets are then forwarded in accordance with their category and priority. Therefore, the ticket must be correctly categorised to avoid wasting time and resources while routing it.
When tickets are classified manually, there are typically too many to tag and too many categories to select, which slows down the entire routing process because a lot of time is wasted processing these incorrectly marked tickets. There is also a high possibility of manual mistakes in categorizing the ticket. This is one of the fundamental causes for why automated ticket classification is so important.
We decided to automate ticket classification as the approach to issue resolution. Based on previous ticket description data, our system applies machine learning techniques to anticipate the appropriate category, sub-category, issue bucket, and priority. Its ability to make decisions without human input is a benefit.
2. Methodology and Analysis
We will discuss the following to help you comprehend how our ticket classification system is implemented:
- The dataset used in this project.
- Steps taken to clean the data.
- Applied algorithm for this system.
- The deployment follows the findings of the classification model in production.
2.1. Dataset
We collected a dataset of about 10,000 tagged issue tickets on various issues from the ITSM Ticketing tool to execute our experiment. The fields Ticket Description, category, ticked id, created time, closed time, sub-category, issue bucket, and priority are included in each issued ticket. The description of each ticket is given in free-form natural language text. This study predicts the right category, sub-category, issue bucket, and priority using the ticket description. The rest of the attributes, such as ticked id, created time, and closed time, are not taken into consideration.
2.2. Data Preprocessing
We can observe that a dataset has 55 columns, of which 6 are significant. Additionally, specific text fields in the data include extra spaces, non-characters, punctuation, etc. Algorithms like machine learning cannot be used directly on text data, so it should be translated into vector format before being ingested into machine learning pipelines. Since there are only a small number of fields with ‘nan’ values, The best strategy to handle this tiny number of fields is to exclude rows with ‘nan’ fields.
As a first step, we implemented basic text cleaning strategies like Filtering required columns, handling null values, ignoring case, punctuation, and often used terms known as stop words that don’t provide much information. Used stemming and lemmatization algorithms to correct misspelled words and reduce words to their stem.
2.3. Applied Algorithm
This explains the application’s approach and how it was assessed. We choose to utilise BERT and zero-shot learning for our classification model in order to make it easier to formulate the goals of the present problem statement and to influence the outcomes. Identifying a set of goals is the first significant methodology stage. Goals must be established in a way that makes it possible to assess them since they are entities that need to be evaluated. The second step is to determine the metrics that will be used to evaluate the application. We first set goals, each of which addresses a separate issue raised by our classification model:
- To create a classification model that uses the ticket description to predict the correct category, sub-category, issue bucket, and priority.
- The accuracy with which the classification model correctly predicts the category, problem bucket, and priority.
- How frequently does the model identify the right assignee when some category, issue bucket, and priority distributions are not in balance.
- To build the generic code so that the model continues to function even if new categories, issue buckets, and priorities are added.
A dataset is first retrieved, after which data preprocessing—the removal of undesired data—takes place. The next step is to divide the dataset into two sets, one for training and the other for testing. The data is split so that the last 15 days’ volume of tickets is utilised as test data and the remaining tickets as training data. The training and test datasets are represented by the four variables x train, y train, x test, and y test. Data splitting is done in order to test the classifier’s performance on a new dataset that has never been used before.
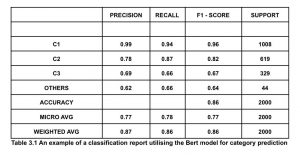
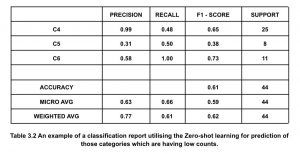
The second stage is building the classification model’s machine-learning pipeline. We trained the training data with the BERT algorithm to predict the category, sub-category, issue bucket, and priority. The model will select the top 3 classifications of the category, sub-category, issue bucket, and priority according to the counts of each classification, and the remaining classifications will be grouped under the name ‘others’. After the classifier has been trained, the same classification model is applied to the test data set, and the predicted outcomes are noted. Once the outcomes were predicted, we handled the tickets that the BERT model had classified as belonging to the group ‘others’ using zero-shot learning. The model tries to embed the sentence and identify any possible classification names into their respective latent representations. The model uses the training set to learn a linear projection to align the label embeddings. This approach attempts to match the sentence embedding during testing and predicts the appropriate category, subcategory, issue bucket, and priority. Therefore, by using this strategy, we could classify tickets for certain classifications with low counts with a good accuracy score.
The final step is to specify the performance metrics that will be used to evaluate our classification model’s prediction. A model’s classification performance can be evaluated using a number of indicators. A group of metrics that are appropriate for the current purpose should be determined because the data used deals with a multi-classification problem. In this, the models for multi-class classification are evaluated using the confusion matrix, precision, recall, and f1-score.
2.3.1. Confusion matrix
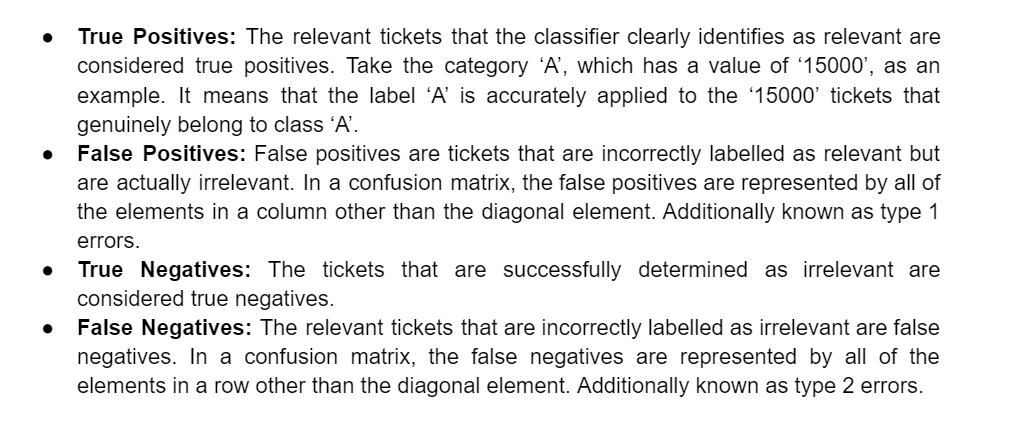
The confusion matrix is one of the widely used measures for evaluating classification models. Each cell in the data matrix c[i, j] represents an occurrence that is incorrectly assigned to the label j when it truly belongs to label i. Each row in the matrix represents the number of tickets categorized according to the actual labels, and each column in the matrix represents the number of tickets classified according to the model’s predictions. The ticket counts of the number of correctly categorized tickets for each group are represented by the diagonal elements, c[i, I], and the off-diagonal elements represent the incorrectly classified tickets.
The confusion matrix illustrates several classification errors. The list of common mistakes made by classifiers is provided below:
2.3.2. Precision
A measurement of result relevance is precision. It is the percentage of tickets correctly identified as relevant compared to all tickets categorised as relevant.
Precision = TP / TP +FP
2.3.3. Recall
Recall measures the proportion of relevant tickets that were accurately identified as such. It can be computed using the formula below.
Recall = TP / TP +FN
2.3.4. F1 – Score
The harmonic mean of precision and recall is known as the f1-score. It offers a balanced optimization score that accounts for both recall and precision. The calculation is as follows:
F1 – Score = 2*Precision * Recall / Precision + Recall
4. Deployment and Containerizing Application
4.1. Docker and AWS ECS
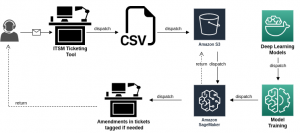
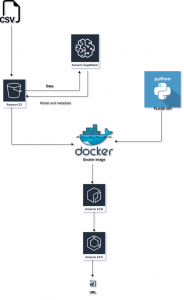
The combination of Docker and Amazon ECS makes it possible for programmers to quickly and easily go from a local context to a cloud context and run apps using Compose files on Amazon ECS. This allows developers to utilise the Docker Compose CLI to set up an AWS context in one Docker command. After running the docker image as your container once the docker image has been constructed following is the AWS setup for our application:-
- The model has been stored in an AWS S3 storage container.
- The lambda function provides the integration procedure for end-to-end flow, which verifies authentication.
- To incorporate flow, the Jenkins pipeline has been developed.
- The front and backend have been implemented using EC2 instances with CPU processors.
- AWS’s ECS clusters are utilized for model deployment.
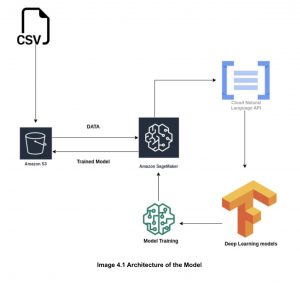
- The models have been retrained using AWS Sagemaker.
5. Conclusion
This paper describes a classification model based on supervised machine learning and deep learning algorithms for automatically assigning tickets. The classification model is trained using a dataset of previously categorized tickets. The time spent on the ticket classification procedure must be decreased. Routine labor is involved in manually sorting tickets, and it takes several days to route thousands of support tickets. Our efficient classification engine lowered the time it took to classify each ticket from minutes to seconds. There have been many experiments on the training dataset; however, it is clear from the results that the BERT with Zero-Shot learning text classification performs well and has a good f1-score across all the groups. To assess the model’s performance on actual tickets, it is deployed in production using AWS. Two weeks of actual tickets are used to evaluate the model. The model’s results for the Category, Sub-Category, Issue Bucket, and Priority all had high f1 scores.