
Video Analytics in OTT: Unlocking Performance with KPIs
Introduction
A Video Analytics Tool is capable of analyzing video data and providing insights, feedback, or actions based on a set of criteria. It gives deep insight into the behavior of the viewer, performance of the content, and technical quality of experience (QoE) so that the OTT provider can make data-driven decisions to optimize their service.
Normal analytics vs. video analytics
While Normal analytics track the page views and clicks, Video analytics tools in OTT apps are providing much more data, insights into viewer behavior, and content performance. They know the streaming behavior like buffering or video quality and also the complex viewer journey through content.
Video Analytics Tool’s Specification
-
Focus on video content and other video-oriented metrics
It doesn’t just count app opens but video plays, unique viewers, total watch time, average view duration, completion rates, and audience retention; it breaks down the difference between viewing live streams and video-on-demand engagement.
-
Quality of Experience (QoE) Monitoring
Video delivery technical health is monitored by these sets of buffering tools. This includes: Buffering Ratio/Frequency: The rate at which and for how long users are being disturbed by the system. Video Start Time (VST): The time it takes from pressing the play button to actually starting to play a video.
-
User Journey and Engagement Tracking
It tracks the user’s journey in the app, not just related to video. This includes: How users find content (search, recommendations, Browse categories). Identifying top-performing titles, genres or series. Clicks on “add to watchlist”, “share”, “like” or navigation elements. Sequences of consumption.
-
Audience Understanding
It aids in dividing the viewers by their watching patterns, types of devices they use, where they are geographically located, and other demographic details (if gathered) which allows for tailored content suggestions and focused marketing.
-
Makes money info (for AVOD, SVOD, TVOD)
For ad-based models (AVOD), it monitors ad shows, rates at which ads are fully watched, and click-through rates on ads. It tracks the take on and churn for the subscription (SVOD) and transactional (TVOD) models, along with average revenue per user (ARPU) and customer lifetime value (CLV), tying them to content use.
-
Data aggregation across platforms
An OTT app may be present on many devices (mobile, smart TV, web, game console). A good video analytics tool will collect and unify data from all these to provide a holistic view.
-
Real-time and Historical Data
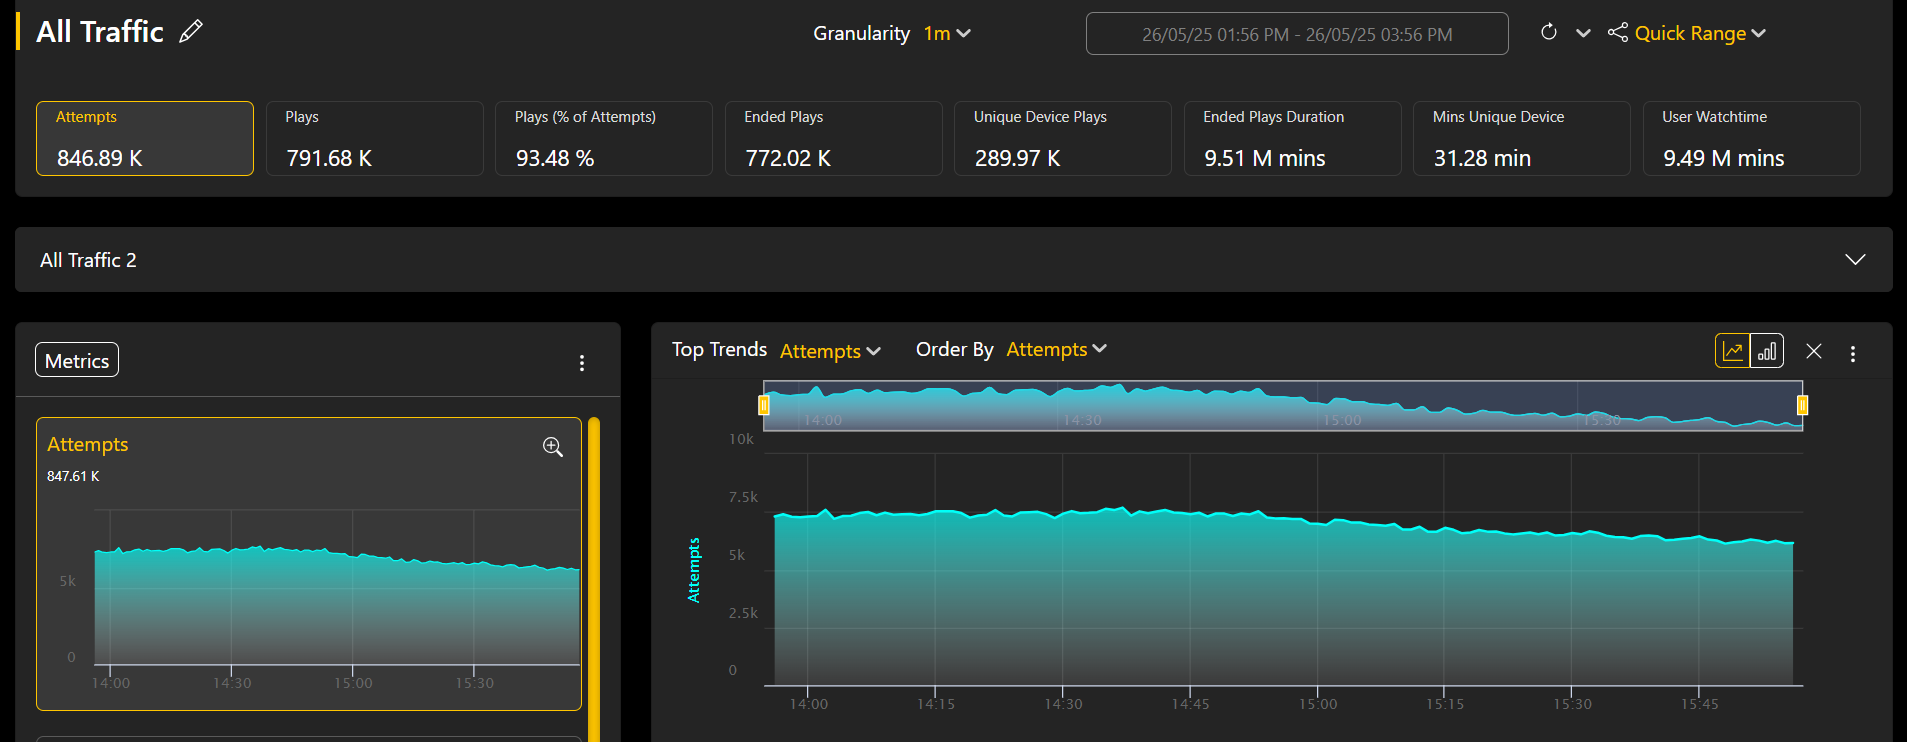
Provides both real-time dashboards for immediate issue detection (e.g., a sudden spike in buffering during a live event) and historical reports for long-term trend analysis and strategic planning.
Tools Available for Analytics in Market
- MoEngage
- Conviva
- Omniture
- Mixpanel
- Godavari
- MUX
- Akamai Media Analytics
- Bitmovin Analytics
- Accedo Insights
- comscore
Pros and Cons of Video Analytics Tools
1. Pros of Video Analytics Tools
- Deeper Audience Understanding
- Improved Quality of Experience (QoE)
- Optimized Content Strategy
- Enhanced Monetization
- Personalization
- Marketing Effectiveness
2. Cons of Video Analytics Tools
- Cost & Complexity
- Data Volume & Storage
- Accuracy & False Positives/Negatives
- Privacy & Ethical Concerns
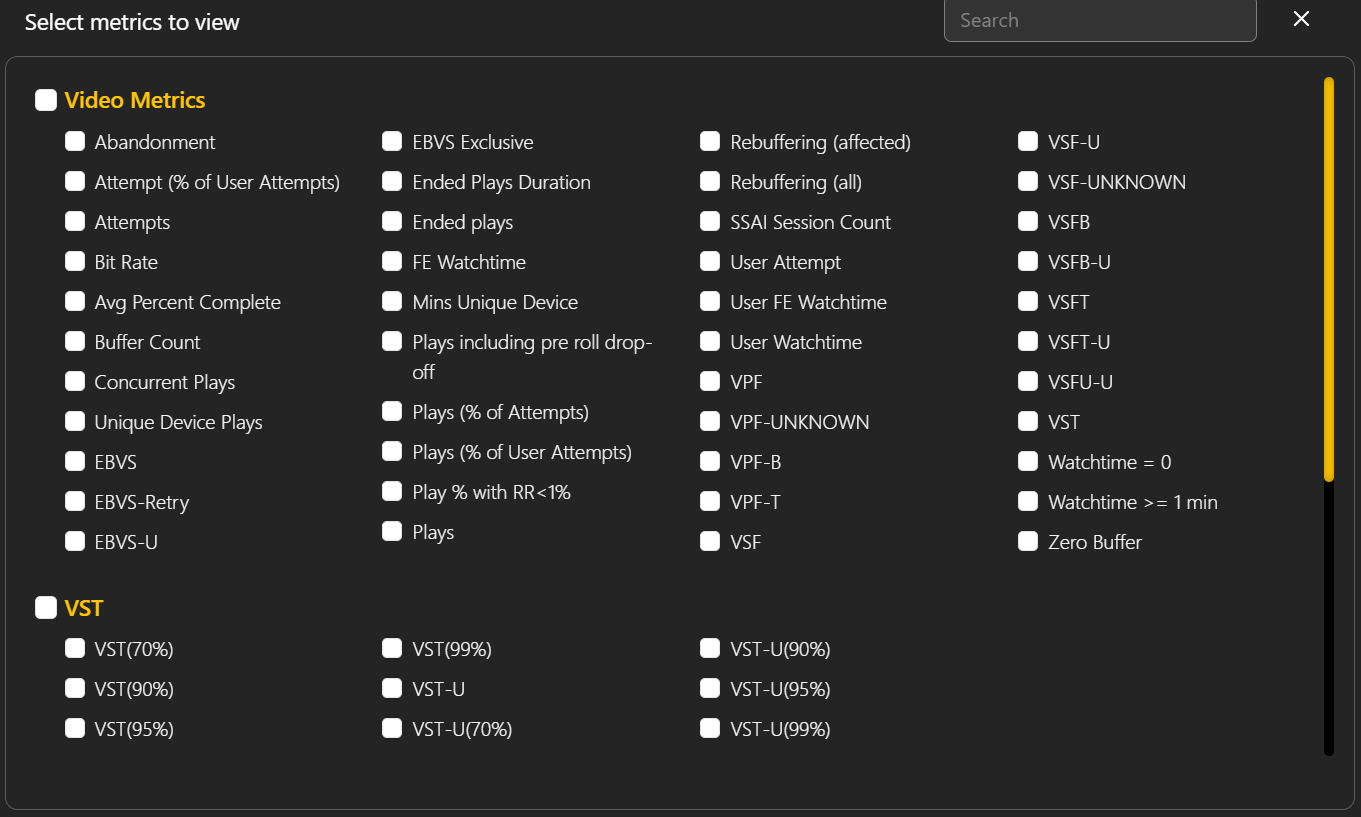
Key Attributes in Video Analytics Tools
-
Video startup time (VST)
Video startup time is the number of seconds between when the user clicks play or video auto-starts and when the first frame of a video is rendered, excluding any pre-roll ads. Any ad startup time and ad playback are not counted toward VST. If content is pre-fetched in the background while an ad is playing, this buffering is not counted toward VST because it is not perceived by the user.
-
Exits before video start (EBVS)
EBVS measures the attempts that terminated before the video started—without a reported fatal error. If a fatal error is reported when the video terminates before starting, the video termination is counted as a VSF instead of EBVS. The most common reason for EBVS is that content isn’t loading fast enough.
-
Video playback failures (VPF) – business and technical
Video playback failure occurs when video play terminates due to a playback error, such as video file corruption, insufficient streaming resources, or a sudden interruption in the video stream.
-
Video start failures (VSF) – business and technical
VSF measures how often attempts terminated during video startup before the first video frame was played and a fatal error was reported.
-
Streaming Performance Index (SPI)
Conviva’s proprietary SPI score looks at benchmark thresholds and grades the overall quality of every stream based on video start failure (VSF), exits before video start (EBVS), rebuffering ratio, video playback failures (VPF), video startup time (VST), and picture quality.
-
Rebuffering ratio
Rebuffering is when the video stalls during playback and the viewer must wait for the video to resume playing.
-
Attempts
Attempts counts all endeavors to play a video which are initiated when a viewer clicks play or a video auto-plays.
-
Concurrent plays
Concurrent plays is the maximum number of simultaneously active sessions during a given interval.
-
Average Bitrate
Refers to the average amount of data transferred per unit of time, usually measured per second, commonly for digital music or video.
Conclusion
With a wide range of video analytics available in Market, each offering unique features, you can select the one that best tool for your OTT application’s requirements and budget. For instance, you might choose the Conviva tool which is cost effective and user-friendly.
