This is a blog series in continuation to a Use Case on How the team at TO THE NEW reduced monthly AWS spend from $100K to $40K in 90 days for a client. In this blog, I would explain how we leveraged infrastructure monitoring to save cost by removing idle resources.

Before getting deeper into any Cost Optimisation strategies, let us discuss how we choose and implemented Infrastructure Monitoring Tools in our ecosystem. In the initial days of our engagement with the customer, we ensured the customer has a proper Monitoring system in place, as it can provide ample insights about the infrastructure. Moreover, in a case of Microservice Architecture, it helps to identify issues/problems at an early stage.
Most of the customer’s use only AWS Cloudwatch Monitoring in their ecosystem, as it provides metrics for all the AWS services and it integrates well other AWS services. We have our custom scripts that extract data from AWS Cloudwatch and helps in identifying underutilized and overutilized EC2, EBS, RDS, ELB etc. The only disadvantage that we see with AWS Cloudwatch monitoring is setting up custom metrics for EC2 disk and memory monitoring. It works well if you have only a few servers, but if you have 400+ EC2 instances, setting up disk and memory scripts and custom metrics can be a costly affair. At the time of this activity, Cloudwatch uses to retain only last 14 days and it is very less time to understand the complex microservices ecosystem and therefore we opted for third party monitoring solutions like New Relic, Nagios, and Pagerduty.
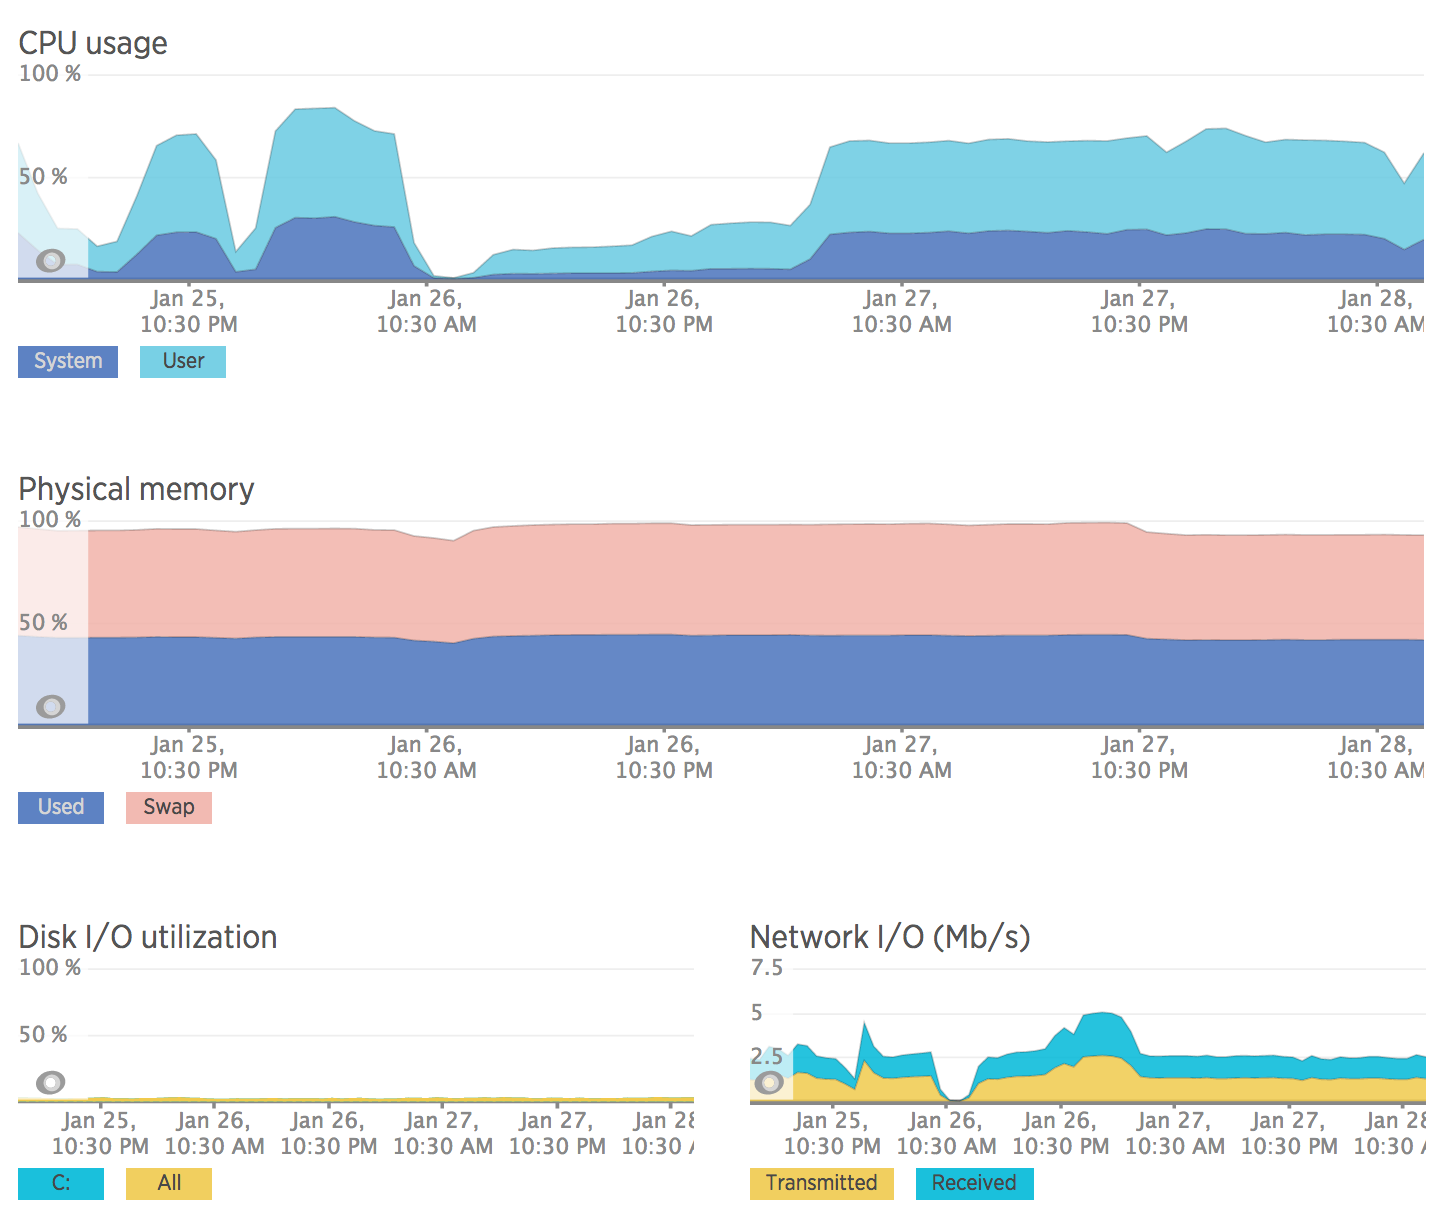
- Server Monitoring: As discussed earlier AWS Cloudwatch doesn’t provide operating system level monitoring, hence we ended up using NewRelic Servers Monitoring tools as they provide detailed insights about CPU, network, disk io, and processes. To setup NewRelic Server Monitoring agent you just need to install NPI package and update your account license key. To make sure every system in our ecosystem has the NewRelic agent installed, configured and added to specific alert policies, we have developed custom chef cookbook using which we manage NewRelic on all our servers.
- Application Performance Monitoring:
- NewRelic APM: The development teams heavily rely on APM for identifying performance bottlenecks and identifying code level issues. APM provide us many key metrics like response time, app server time, throughput and error rate. In the initial days we were only using APM for production applications, but now we use for all staging and QA applications. It helps in identifying performance issues in the development life cycle. Screenshot: NewRelic APM.
- ELB Cloudwatch Metrics: We also rely on AWS ELB Cloudwatch metrics for application monitor, it provides us great insights about the application latency, error rate, healthy/unhealthy instances behind the ELB etc.
- NewRelic APM: The development teams heavily rely on APM for identifying performance bottlenecks and identifying code level issues. APM provide us many key metrics like response time, app server time, throughput and error rate. In the initial days we were only using APM for production applications, but now we use for all staging and QA applications. It helps in identifying performance issues in the development life cycle. Screenshot: NewRelic APM.
- Availability Monitoring:
- URL Monitoring: In our ecosystem, we have 40+ internal services those are consumed by internal applications and 10+ public endpoints which are accessed by end users and third party teams. For monitoring public endpoints we are using NewRelic Synthetics, it enables us to monitor endpoint from different geo locations and for private endpoints, we are using Nagios. Both the monitoring tools provide SLA report on a weekly and monthly basis, which can be shared with the appropriate teams.
- Service Monitoring: For monitoring database clusters (MongoDB and Elasticsearch), queuing system, internal endpoints we are using open source Nagios. We preferred Nagios over any other third party solution because it is highly customizable and it is open source. If you want to integrate your Nagios with Pagerduty, you can follow this Blog it is written by one of my colleagues.
- AWS Monitoring:
- Underutilized/Idle Resources: We leverage our custom scripts to generate a report for all under-utilized and idle resources (EC2, ELB, ELB, EIP, Snapshots, RDS, Legacy Instance Type) in the AWS account. If you want to use those scripts, you can follow “6 Tips for AWS Cost Optimization” blog written by my colleague.
- S3: We heavily use AWS S3 for backups and hosting static content, on cross checking S3 bucket storage in Cloudwatch for last 15 days, we found we add 300 GB of backup data on daily basis. To reduce increasing storage cost, we enabled lifecycle policy (standard storage -> glacier -> deletion ) on backup S3 bucket’s and this resulted in good cost savings.
- Cloudfront: We heavily use AWS CloudFront for serving static content from S3, but we were not using compression feature offered by CloudFront. By enabling compression in all the CloudFront distributions, we were able to reduce data transfer out by 30%. For more details, you can check this blog.
How Monitoring was the key factor in determining next steps for us: After having the monitoring system in place for 30 days, we gathered all the data from different sources NewRelic, Cloudwatch, and Nagios. The results were astonishing as mentioned below:
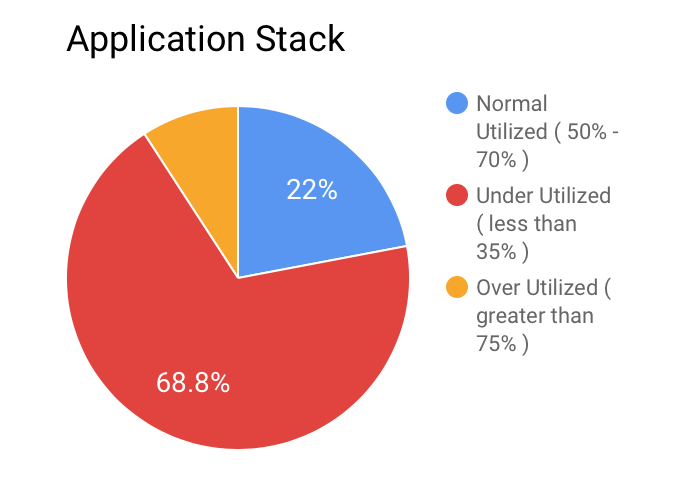
- Application Stack: In the application stack, we were running about 222+ EC2 instances and their maximum CPU utilization was less than 35%
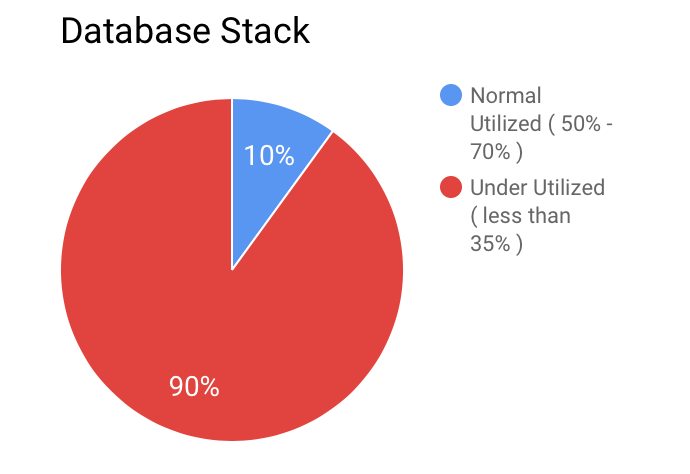
- Database Stack: In the database stack, we were running approx 120+ EC2 instances and their maximum CPU utilization was less than 25%
In the next blog, we will be discussing “AWS Cost Optimization Series | Blog 3 | Leveraging EC2 Container Service (ECS)“. In that blog, we will be discussing challenges we faced during the migration and what we did to resolve them.