Infrastructure monitoring in the cloud is the topmost priority for any application running in the cloud. This includes monitoring the web servers, databases, applications & various tools being used. Datadog not only provides monitoring but also has alerts integrated so that you get notified for certain type of issues which occur. For example a lot of sudden traffic on your web page.
Datadog is a widely used service that can be integrated with almost every cloud service provider, automation tools, databases & other component tools. Datadog also gives you API access & you can create your own monitoring metrics & monitor things from within your application.
Datadog is a very deep tool though, in this blog, we will go through a simple setup of Datadog on an Ubuntu server running & monitor various metrics through the Datadog dashboard.
To monitor your entire infrastructure in your AWS account you just need to make a user who has “Read Only Access” to your account. Also, when working with AWS you would also want that you have a centralized place where you would want to monitor everything in your AWS account. In that case there is an integration “AWS” available inside Integrations – ”
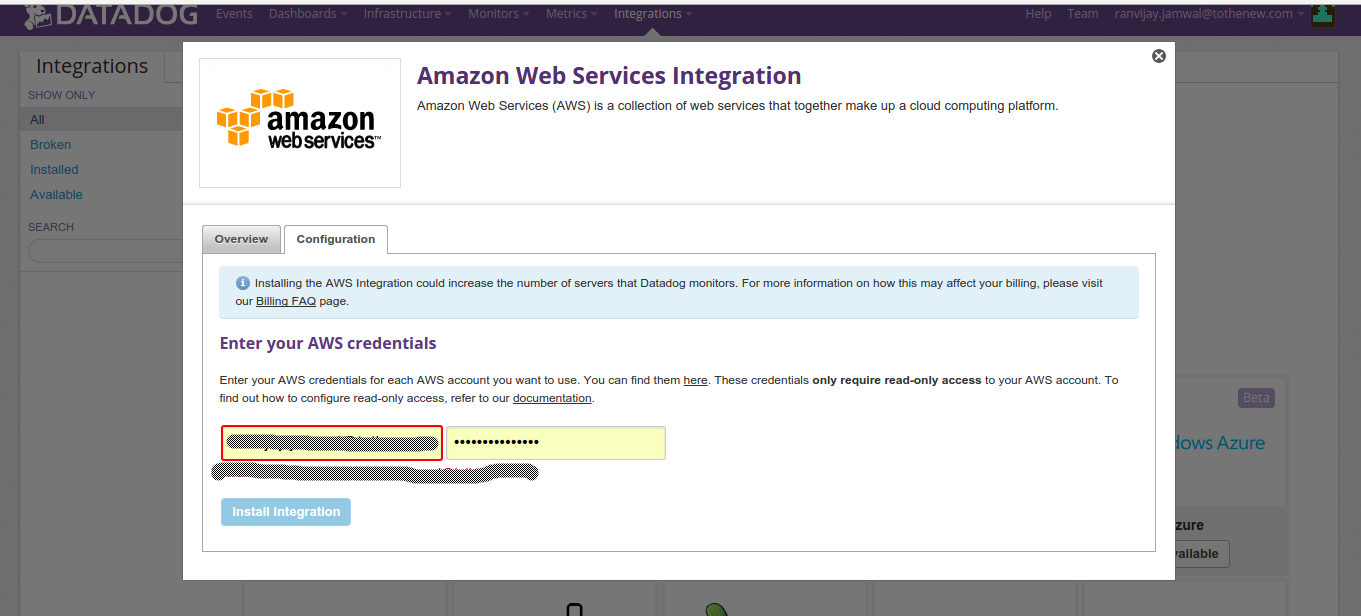
You can do the following with this integration according to DataDog :-
- See automatic AWS status updates in your stream
- Get Cloudwatch metrics for EC2 hosts without installing the agent
- Tag your EC2 hosts with EC2-specific information (e.g. availability zone)
- Get Cloudwatch metrics for other services like ELB or RDS
- See EC2 scheduled maintenance events in your stream
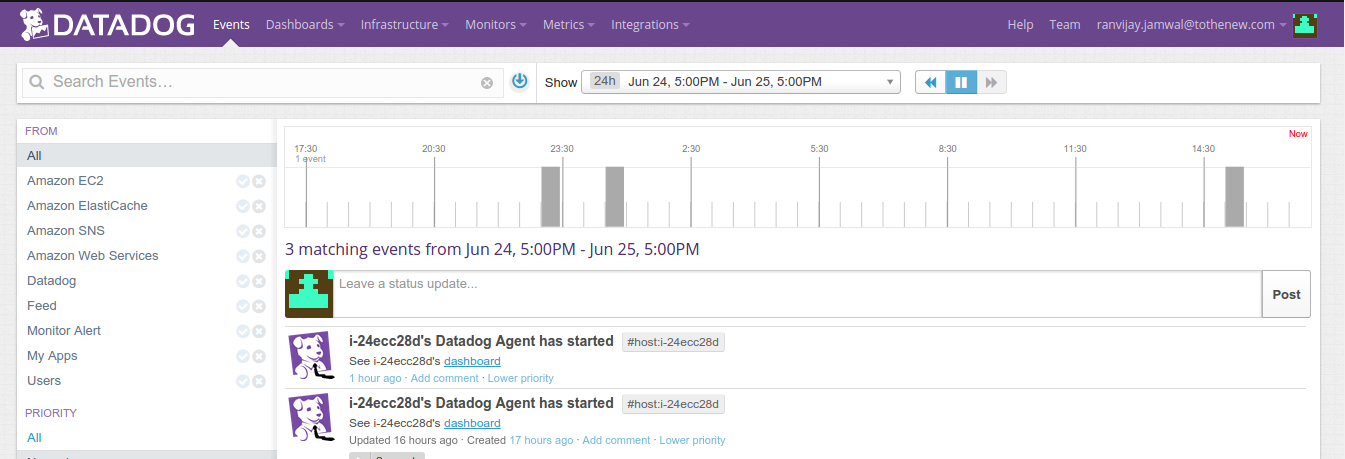
After installing the integration from the integrations tab you will see Amazon events
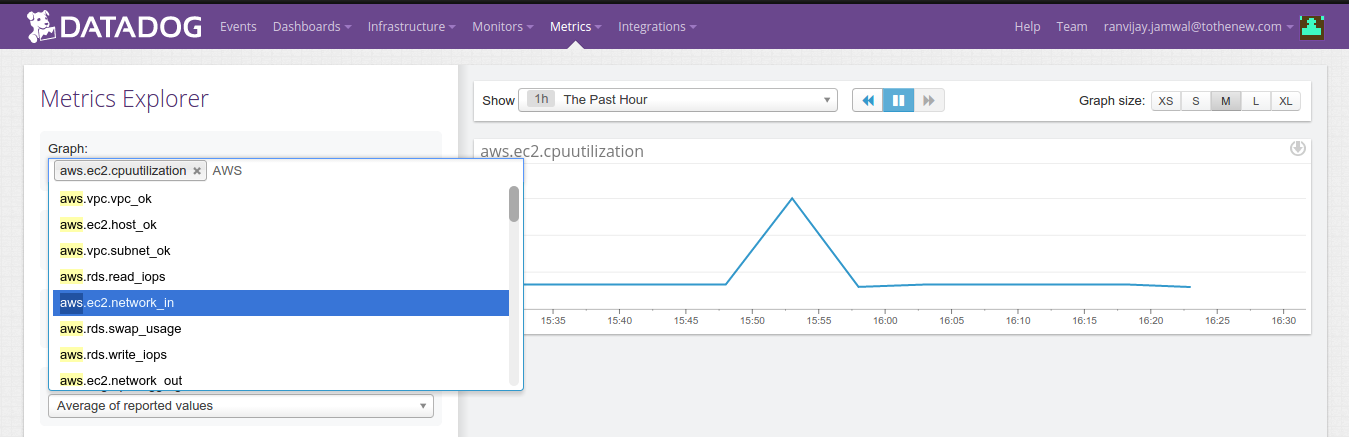
Also in the metrics tab you would see the various AWS options.
We would be talking about monitoring later in this post.
Setting up Datadog for a single host manually
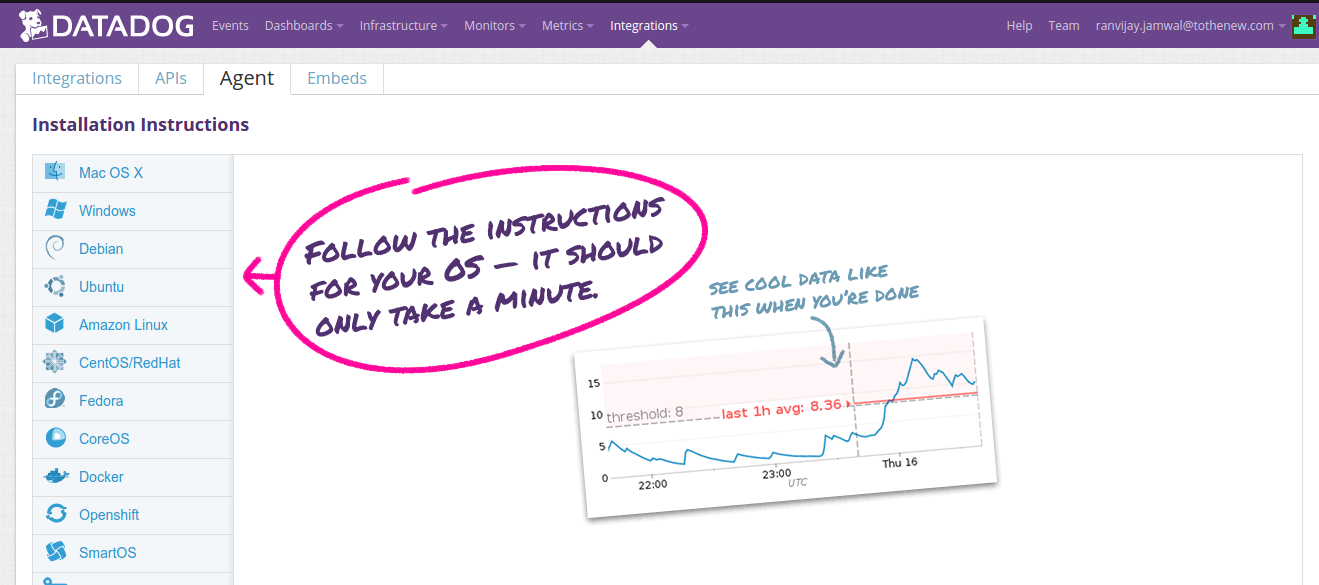
We will go ahead with this step considering the fact that you have an Ubuntu server. Also that you have a Datadog account in which you have signed in. Now, we need to install the Datadog Agent. Go to Integrations & then click on Agent. There is a one step command as well as multiple commands for various platforms. Choose Ubuntu & proceed by copying the command & running it in the same server where PHP application is running.
You would get a command as shown below:-
[js]
DD_API_KEY=############################## bash -c "$(curl -L ;
[/js]
Agent is necessary to be installed in order for any monitoring to show up in the Datadog metrics page. Datadog agent will start automatically & if you go to Infrastructure -> Infrastructure list & then Host Map you will see an entry. In Host Map you will see something like below :-
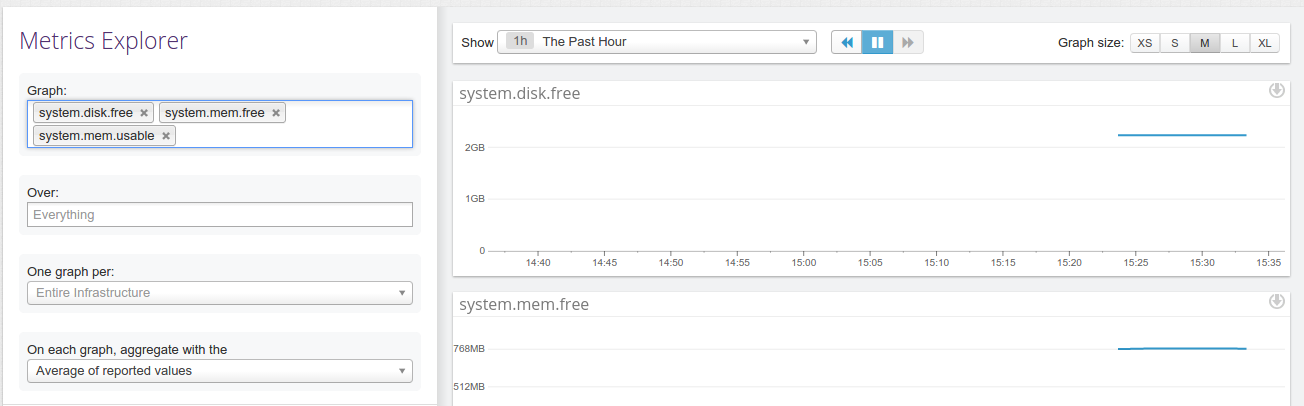
Now, Lets monitor the server metrics. Go to metrics explorer & then choose which ever metric you want.
On the right in the graph, if you click the download like button, it will give you many options, one of them being a custom dashboard. In this dashboard you can group all the metrics from one application & can easily access it.
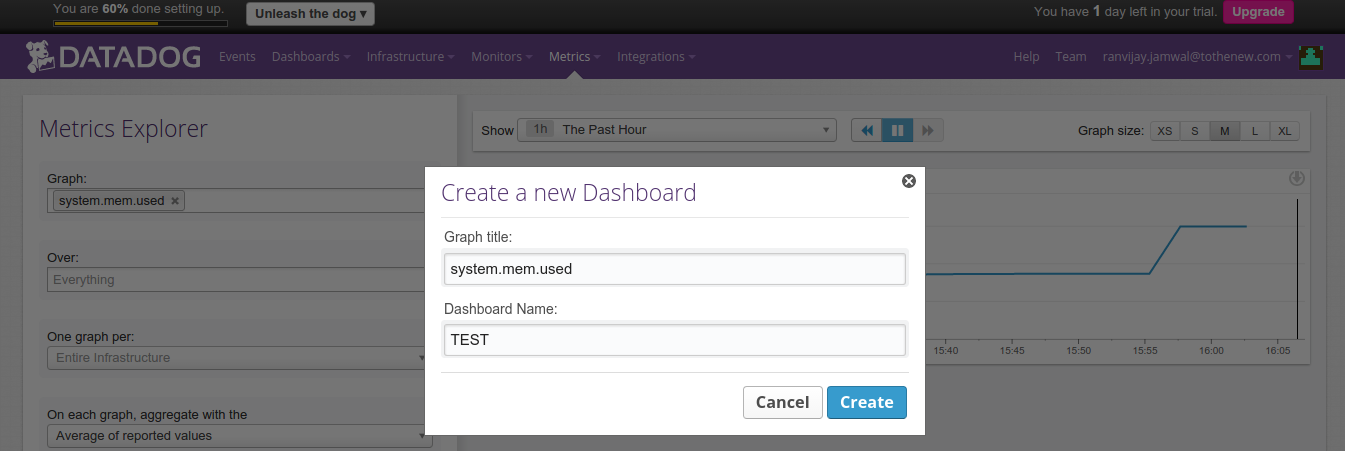
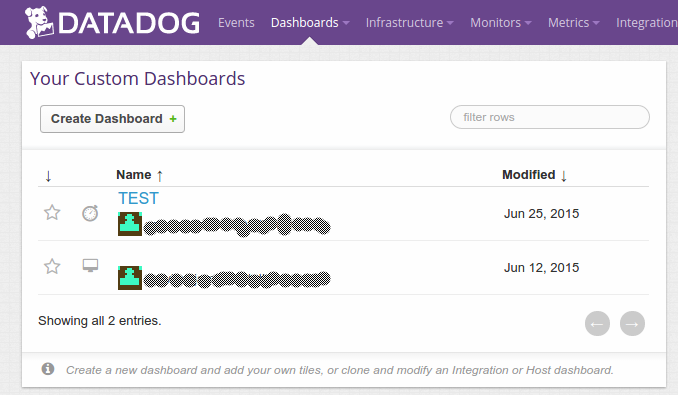
To check out your new TEST dashboard go to dashboards:-
Also you can go into Infrastructure & get more details as below after clicking on the green button in the center of the screen :-
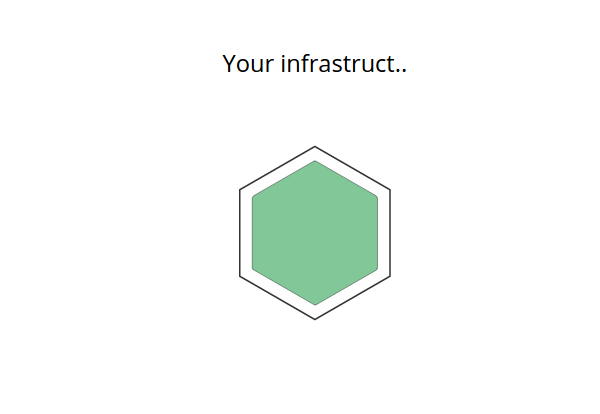
Click the green button which will take you here
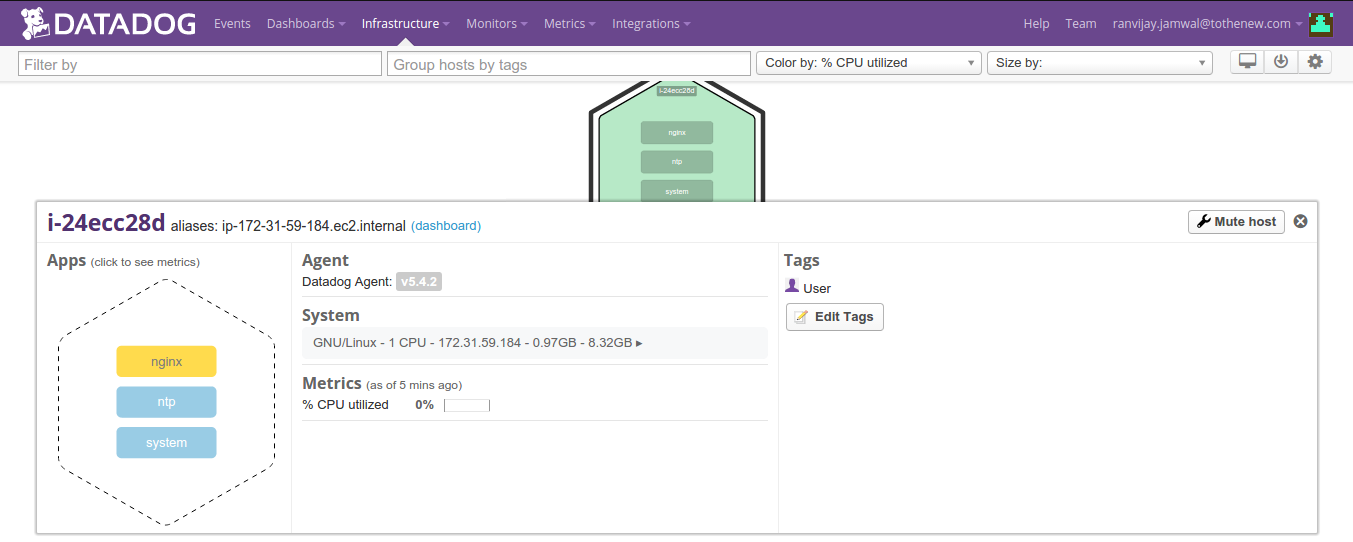
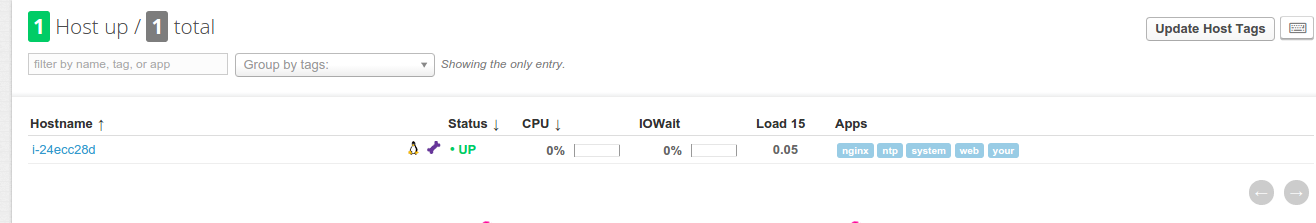
You can also go into Infrastructure list which will give you a overall view of all servers. Since we have just one server running Datadog we will see only one entry there :-
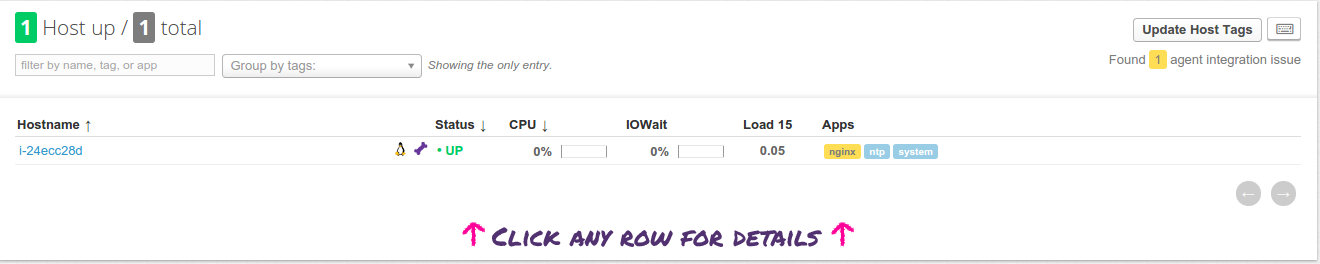
( you wont see the Nginx as appearing in this image )
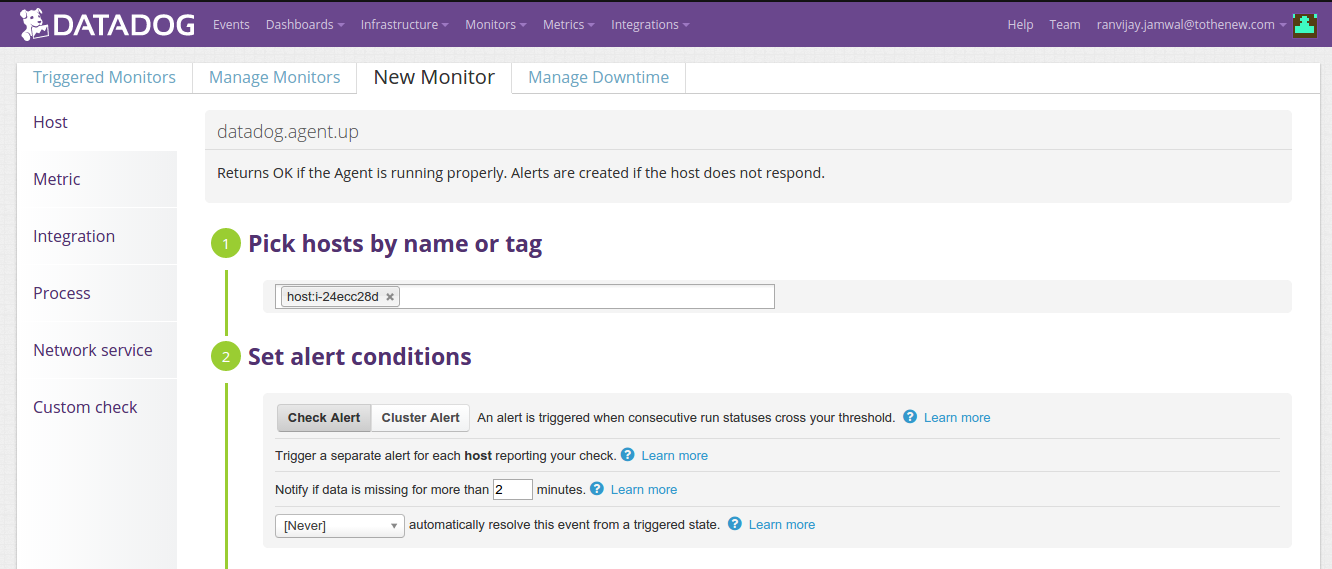
Now, comes alerting for any event you want & for that there is Monitoring. You can monitor individual host machines, integrations, metrics etc. Host monitoring is done as follows :-
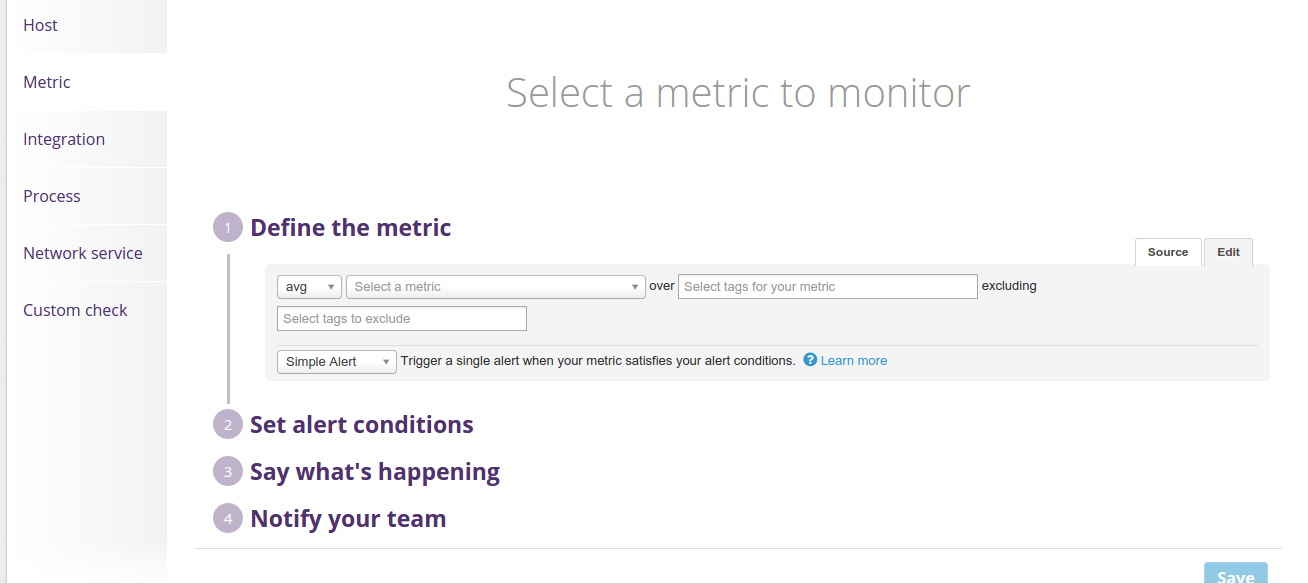
Below is metric monitoring:-
 Notifications are sent via mail & also have other integration options like Pager Duty etc.
In my next blog, I shall be telling you how to setup monitoring for you PHP application & Nginx as well.
Pingback: PHP and nginx monitoring using DATADOG | TO THE NEW Blog