Google Analytics is a freely available web analytics tool offered by Google that tracks and reports website traffic. It is one of the most commonly used web analytics service on the Internet. Google Analytics provide immediate feedback through a dashboard in a language that our stakeholders understand.
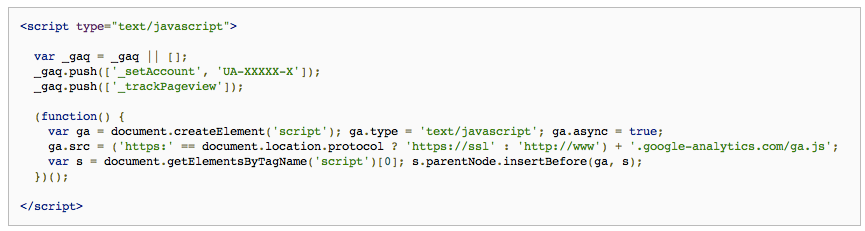
Fig. One small snippet of tracking code of Google analytics
How to Setup a Basic Google Analytics Account
- Sign up or Sign In into your Google Analytics account
- Go to https://www.google.com/analytics/ URL
- It will return a code
- Paste the code just below the </body> tag into your HTML page.
- Put GA code on every webpage
- Edit-> Find and Replace is the easiest option to do this.
- By putting GA code in the template pages, it will be directly accessed by every page
- Go to the Google Analytics dashboard page (configure it according to your use) to see daily metrics
Metrics and Dimensions of Google Analytics
Every report in Google Analytics is made of the valid combinations of their dimensions and metrics.
Dimensions describe characteristics of your users, their sessions and respective actions. The dimension “City” represents the characteristic of sessions and displays the name of the city. For example, “New Delhi” or “Tokyo”, from which each session is originated for the page you want to track. The dimension “Page” describes the behavior of page view actions and displays the URL of each page that was viewed.
Metrics are quantitative measurements of data. For example, the Metric “Sessions” is the total number of sessions for the page you want to track. Similarly, “Pages per Session” metric gives the average number of pages viewed per session.
Valid Combinations: All dimensions and metrics can’t be queried together. Only certain valid combinations of dimensions and metrics can be queried together. Select a valid combination of dimensions or metrics checkbox to see all the other values that can be combined in the same query. Below is the URL where we can see the list of Dimensions and Metrics.
https://developers.google.com/analytics/devguides/reporting/core/dimsmets
How Google Analytics Helps in Day-to-Day life?
- Daily, Weekly, monthly & yearly tracking of web visits by the user
- Graphed on the basis of time
- Which pages they go to, how much time they spent
- Bounce rate
- Entrance pages
- How they got there
- Via Search engines or using Search terms
- Location tracking, operating system used, monitor resolution used
How to Get Automated Data in Google analytics?
Google Analytics Report Automation (Magic) is a Google Add-ons integration that helps in achieving the inputs required to put Google Analytics data into any application script, supported product, such as Google Spreadsheets, Google Docs or Sites.
Steps to get Automated Data in Google Analytics:-
- Open a new Google Spreadsheet, provide the desired name and add a new Add-ons (google-analytics-add-ons) via get add-ons.
- Go to newly added add-ons Google Analytics and click on Create a New Report
- Provide all the inputs for a new query:
Report Name: Enter your desired name
Type: core – Required, no need to change this
Profile ID: ga:<id> – Your profile ID, Required(Mandatory)
Start Date: Either specify the start/end dates or use last n- days field
End Date: 2016-02-24
Last n Days: 7
Metrics: ga:visitors, ga:newVisits, ga:visits
Dimensions: ga:city
Sort: Output returned are sorted alphabetically. If we want to sort it in ascending order. Let’s add -ga:visitors
Filter: ga:medium
SpreadsheetURL: Provide the URL of the page where you want the result or enter the sheet name.
- After providing all the required query inputs value, click on Run Report
- After clicking on Run Report, an automated result will be returned to the user in the sheet or in the provided sheet URL.
Google Analytics enables stakeholders and product owners about their business through its effective reporting. However, there are certain problems that one faces while using it. Good thing is there are alternatives which can be used such as Moz Pro, MixPanels, KISSmetrics and Adobe Analytics.
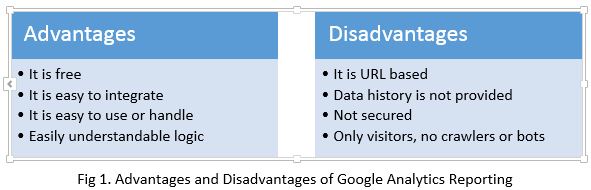
Fig 1. Advantages and Disadvantages of Google Analytics Reporting
So to recap, here we discussed how we can implement automated result of Google Analytics using Google Analytics Add-ons which contains a Magic Script that is run via Google Spreadsheet, and how to utilize your Google Analytics Core Reporting query with the provided input.