Recently, I integrated the monitoring of Hadoop with Datadog. The main aim of the monitoring is to monitor the cluster to check whether it has been running fine and to check other services of Hadoop like the health of the node manager, the health of disk space, etc.
Datadog is a tool that allows you to monitor cloud infrastructure, Windows and Linux hosts, system processes, serverless functions, and cloud-based applications. It can be used to visualize data, explore metrics, manage logs, and perform various other tasks.
What types of monitoring can be done?
Datadog is great for businesses that need:
- Cloud monitoring
- Server performance monitoring service
- Server monitoring tools
- Server usage analytics
- 80+ turn-key integrations for data aggregation
- Alert notifications via e-mail and PagerDuty
- Full API access
- Overlay metrics and events across disparate sources
- An easy way to compute rates, ratios, averages, or integrals
- Sampling intervals of 10 seconds
- Tools for team collaboration
Getting started
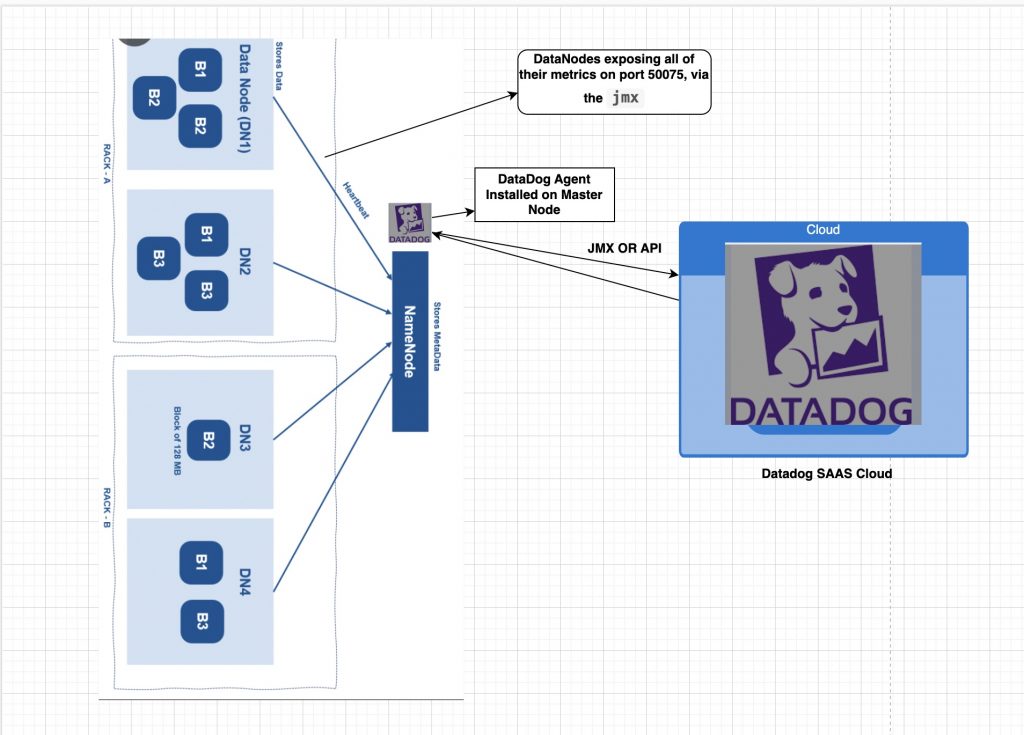
DataDog Integrated With Hadoop
The first thing needed is to install the DataDog agent on the host to enable the data dog services –
Run the below command on your host and pass the DD API key –

Configure the Agent
We will need to create Agent configuration files for our Hadoop. In datadog agent directory, we will find template configuration files for the NameNode, DataNodes, MapReduce, and YARN, which services are running on their default ports (50075 for DataNodes, 50070 for NameNode, 8088 for the ResourceManage)
Under Conf.d directory in the datadog agent directory, we can find multiple directories of the services we want to Monitor.
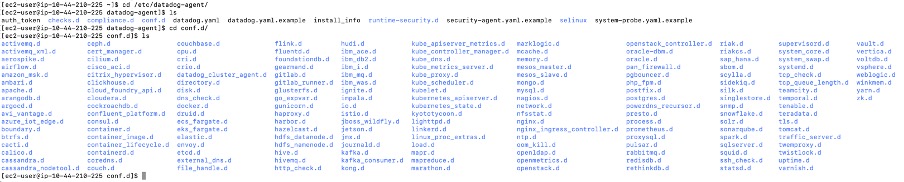
For Moniting Name Node go to Namenode directory and try to cp the conf example file to conf.yaml file –
cp hdfs_namenode.yaml.example hdfs_namenode.yaml
![]()
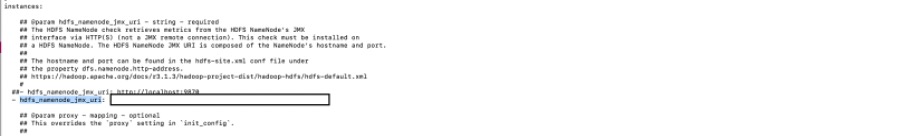
Change the conf.yaml file and pass the hdfs_namenode_jmx_uri – as of your Name Node URL
Once it’s done, Restart the datadog agent and post it to check the status.
sudo service datadog-agent restart
sudo service datadog-agent status
You will see the metrics of the Name node below –
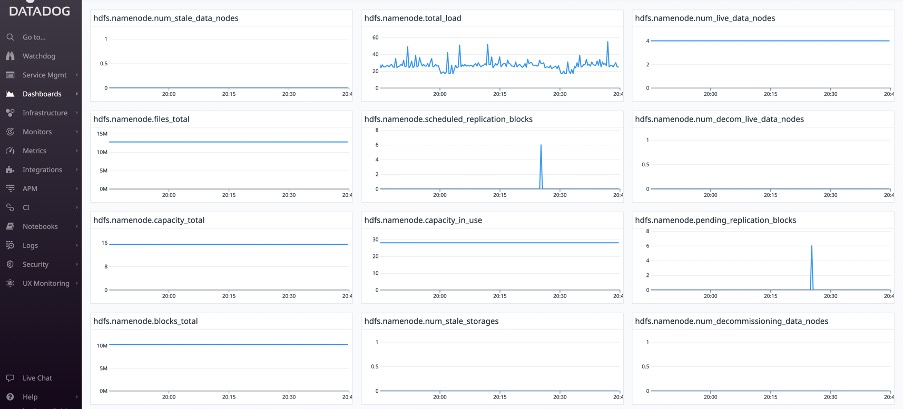
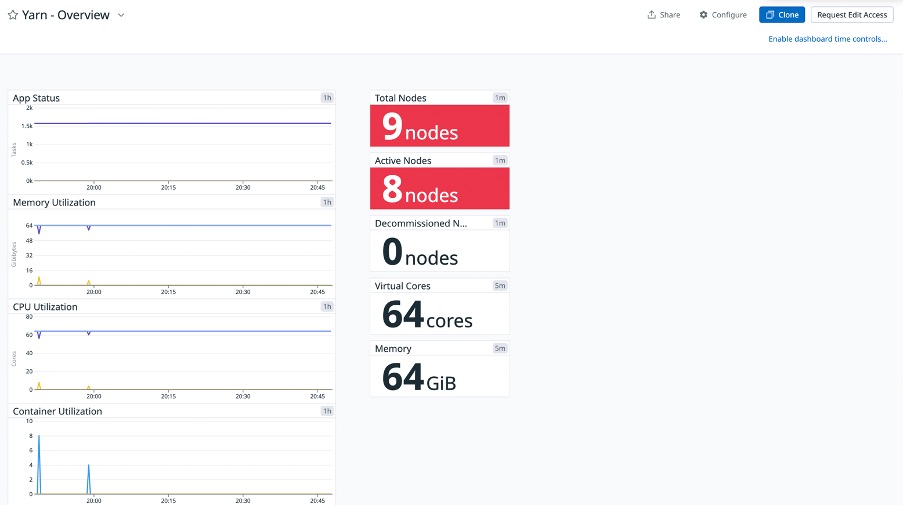
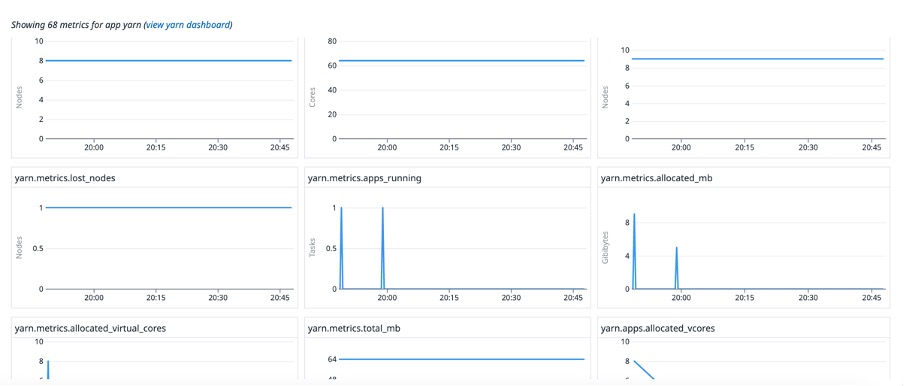
In the same way, we can monitor yarn and other services and can see the Yarn Metrics below –
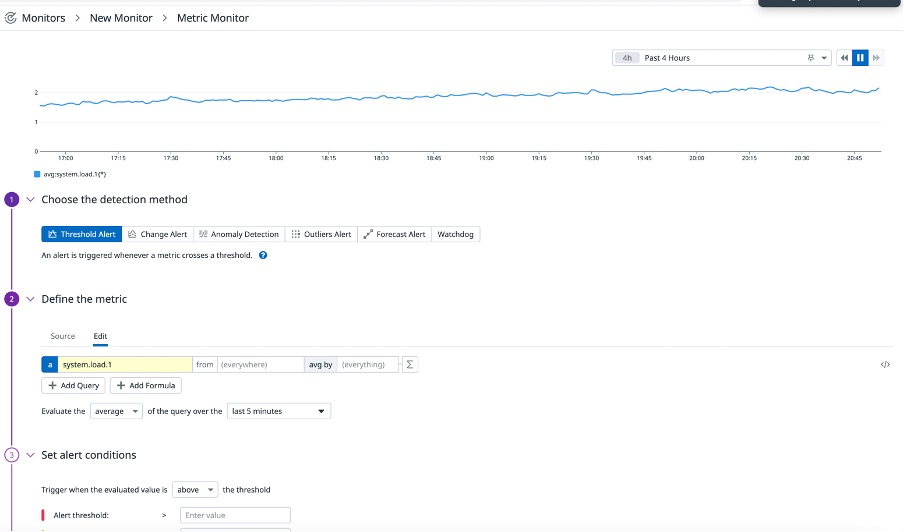
We can also create Monitors for all the metrics that we want by just going to data dog and going to the Monitor putting the details of the metrics, and enabling the alerts –
Conclusion
Monitoring Hadoop with Datadog is a powerful solution for organizations that want to gain deeper insights into their big data infrastructure and ensure its optimal performance. Datadog provides a comprehensive set of tools and features such as Comprehensive Visibility, Alerting and Notifications, Resource Optimization, Historical Data Analysis, Reduced Downtime, and Improved Performance.