Java Memory Management and Garbage Collection Explained (Part 1)
Introduction
Java memory management refers to the process by which the Java Virtual Machine (JVM) allocates, organizes, and reclaims memory used by variables, methods, classes, and objects during program execution. It ensures efficient memory use by automatically managing object creation and destruction, helping developers avoid manual memory handling and common pitfalls like memory leaks.
Types of Memory
In Java, memory is mainly divided into two core regions: the Heap and the Stack.
Both are managed internally by the JVM to ensure efficient execution and memory allocation for various program components.
Stack Memory :
Stack memory is a section of JVM memory that holds method call information along with their local variables. It follows the Last-In-First-Out (LIFO) principle, meaning the most recently called method is the first to be removed once execution completes.
Stack memory is used to store:
- Basic primitive data types such as int, long, double, and others.
- References to objects that reside in the heap memory
Additionally, variables in the stack have a specific scope — which defines where they are accessible. Whenever a method is invoked, the JVM creates a new stack frame to hold its local variables. These variables live only within the method’s scope and are cleared from the stack when the method completes.. Once the method completes, its frame is removed from the stack, and all associated variables are cleared. Control then returns to the calling method, restoring its stack frame and scope.
Heap Memory :
Within the JVM, the heap is used to hold all instances of objects that are created while the application runs. These objects are referenced by variables that reside in stack memory.
Let’s take a simple example: User userObj = new User();
Here’s what happens:
- Using the new keyword instructs the JVM to reserve memory in the heap for a newly created User object.
- The object is created in heap memory.
- A reference to that object is stored in the stack under the variable userObj.
The heap is a unified memory area shared across all threads within a JVM instance. This makes it essential to handle object access carefully in multi-threaded environments. Whereas Stack memory is created per thread. Every thread maintains its own separate stack, which keeps method calls and local variables isolated from those of other threads.
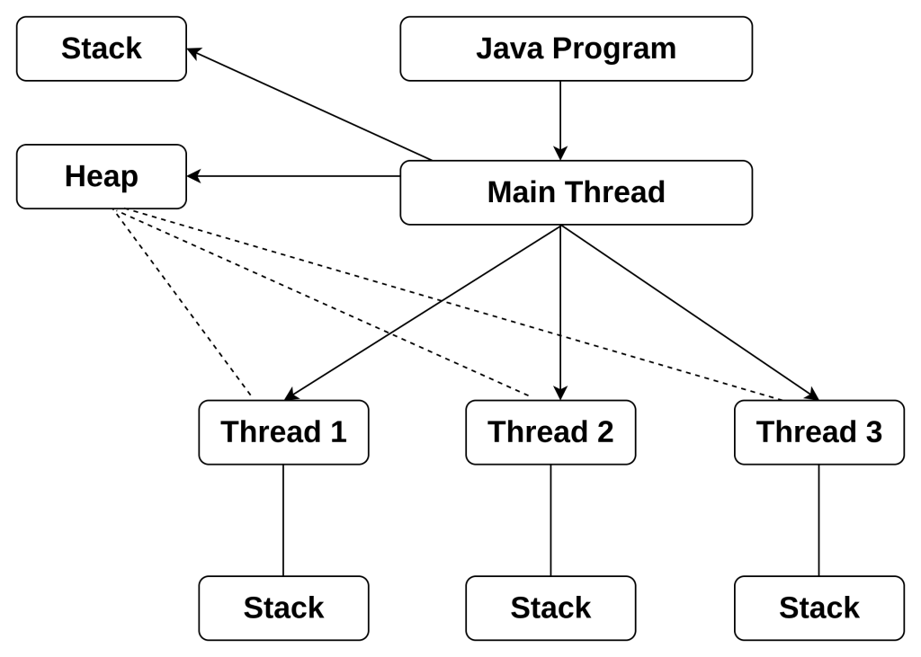
Diagram showing the relationship between stack and heap memory in Java.
Example :
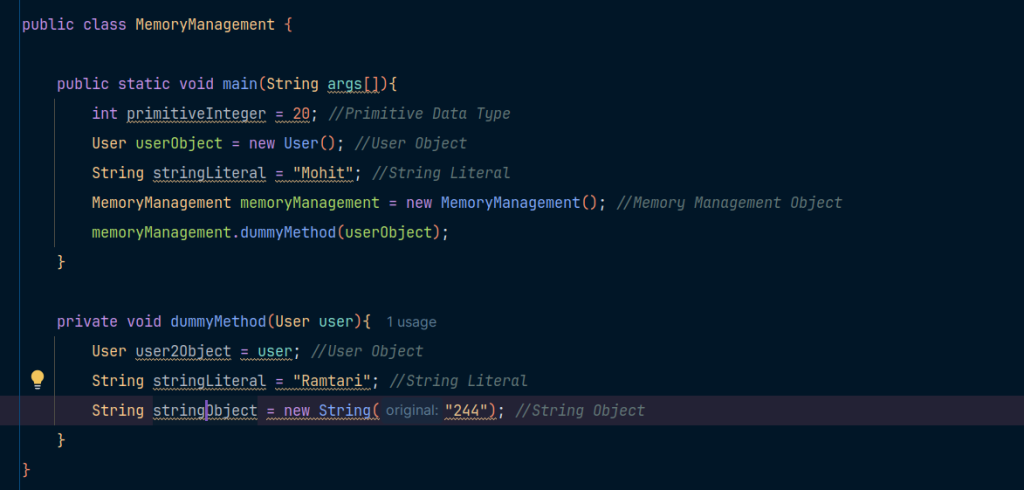
Java code snippet demonstrating how variables in stack memory reference objects in heap memory, including primitives, string literals, and user-defined objects.
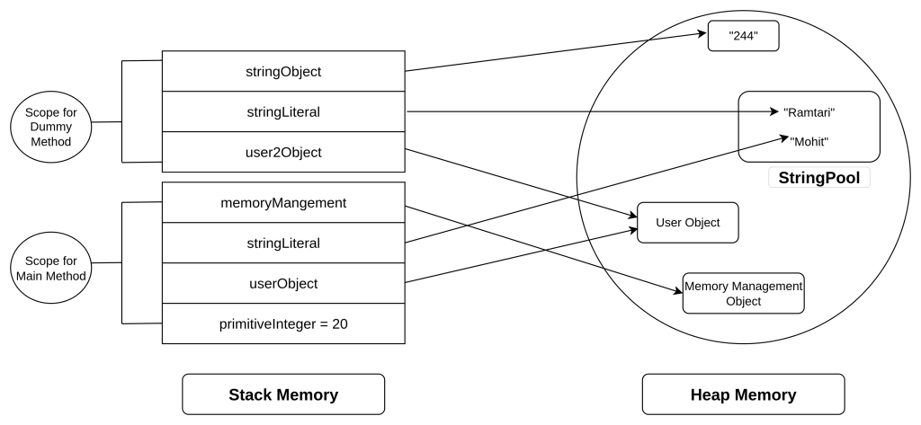
Diagram illustrating how variables in stack memory reference objects stored in heap memory during Java program execution.
As shown in the example above:
- Primitive integer value is stored in stack memory.
- The string literals “Mohit” and “Ramtari” are stored in the String Pool, a part of the method area used for storing string literals.
- A MemoryManagement object is created in the heap memory and is referenced by the memoryManagement variable in the stack.
- A User object is also created in the heap and is referenced by two variables: userObject from the main method and user2Object from the dummyMethod.
- Once the dummyMethod completes execution and its closing bracket is reached, its stack frame is removed in Last-In First-Out (LIFO) order. As a result, all local variables within that method, including user2Object, are discarded, and control returns to the calling method (main in this case).

Diagram illustrating the state of memory after the execution of dummyMethod, showing the removal of its stack frame and how object references are affected.
Once the dummyMethod completes execution, control returns to the main method. Since there is no further code to execute after the call to dummyMethod, the closing bracket of the main method is reached. As a result, its scope also ends, and the corresponding stack frame is removed following the Last-In-First-Out (LIFO) order.
At this point, the stack memory is completely cleared, and all references stored in it are removed. The memory now looks like this:
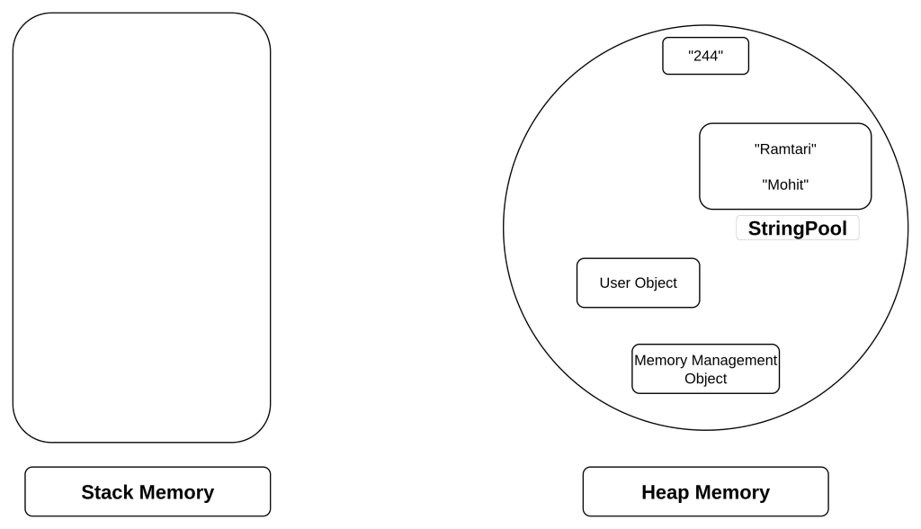
Diagram showing the final memory state after the execution of both dummyMethod and main method, with the stack cleared and only heap objects remaining.
Now that the stack memory is cleared and all references have been removed, the objects in the heap memory remain without any active links pointing to them. This is the stage where the Garbage Collector (GC) steps in to manage unused objects. The Garbage Collector is responsible for automatically identifying and removing objects in the heap that are no longer referenced by any part of the program.
The JVM determines when the Garbage Collector should run. When the GC runs, it reclaims memory by cleaning up all unreachable objects, helping to ensure efficient memory utilization and prevent memory leaks.
Divisions of Heap Memory :
The heap memory in Java is primarily divided into two main areas:
- Young Generation
- Old Generation (Tenured Generation)
In addition to the heap, there is also a separate memory area known as Metaspace, which is considered non-heap memory. It holds information about classes, including their structure, defined methods, and runtime constants. (Note: Metaspace replaced PermGen starting from Java 8.)
Young Generation : Young Generation refers to the section of heap memory where objects are first allocated upon creation.
It is further divided into:
- Eden Space – It is the region where the new objects are first allocated in memory.
- Survivor Space 0 (S0)
- Survivor Space 1 (S1)
The two Survivor spaces (S0 and S1) work in a ping-pong fashion during garbage collection. During a Minor GC, objects that are still alive in the Eden space are moved to one of the Survivor spaces. Objects that survive multiple collections may eventually be promoted to the Old Generation.
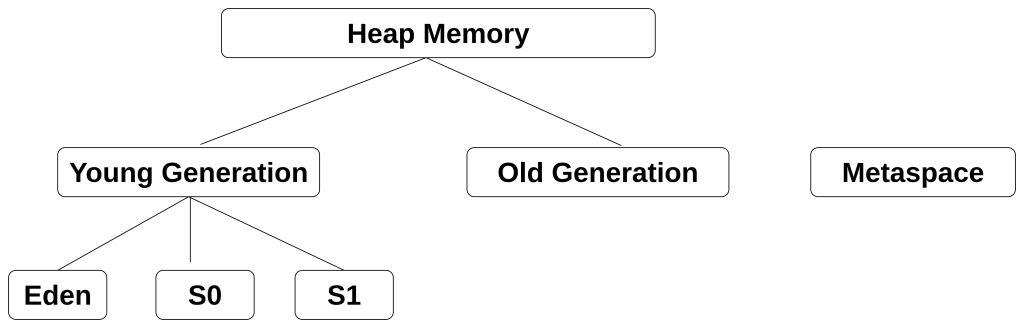
Diagram illustrating the division of heap memory in Java, including Young Generation (Eden, Survivor 0, Survivor 1), Old Generation, and Metaspace (non-heap memory).
Let’s explore how memory behaves when new objects are created.
Suppose we create five objects: O1, O2, O3, O4, and O5.
When these objects are instantiated, they are initially stored in the Eden space of the Young Generation within the heap memory.
The Eden space is specifically designed to hold newly created (short-lived) objects. Most of these objects will become unreachable quickly and are candidates for garbage collection during the next minor GC cycle.
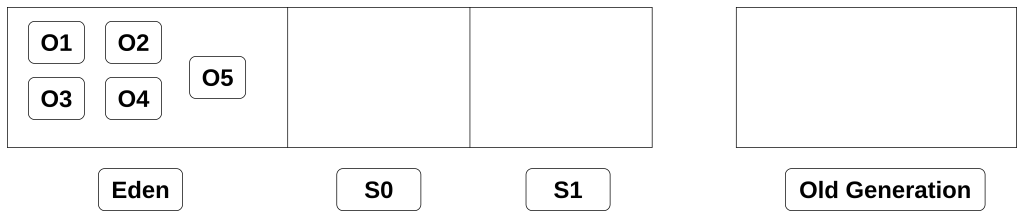
Diagram showing the allocation of five objects within the Eden region of the Young Generation in Java’s heap memory.
Now, let’s assume that objects O1 and O2 are no longer referenced by any variable. When the Garbage Collector (GC) runs, it applies the Mark and Sweep algorithm:
Mark Phase: The GC first scans the heap and marks all unreferenced objects, such as O1 and O2 in this case.
Sweep Phase: It then performs two actions:
- Removes the marked (unreachable) objects — O1 and O2 — from memory.
- Moves the surviving objects (O3, O4, and O5) to one of the Survivor spaces (either S0 or S1) and increments their age, which helps determine their eligibility for promotion to the Old Generation over time.
- After this GC cycle, the memory state changes accordingly:
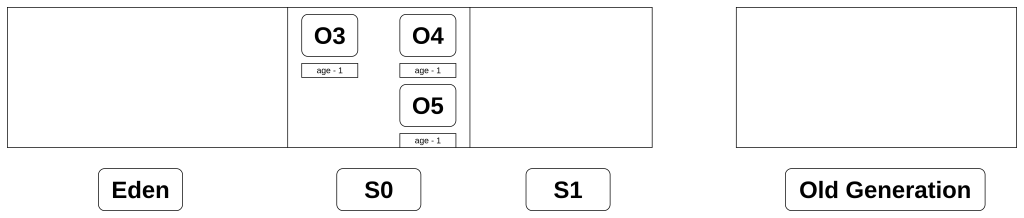
Diagram showing the effect of Garbage Collection using the Mark and Sweep algorithm. Unreferenced objects O1 and O2 are removed from Eden, while surviving objects O3, O4, and O5 are moved to a Survivor space with their age incremented.
Object Movement and Promotion to Old Generation
On subsequent runs of the Garbage Collector (GC), if any of the objects (O3, O4, or O5) become unreferenced, they will be removed from memory. If they are still referenced, they will be moved to the other Survivor space (e.g., from S0 to S1), and their age is incremented by 1.
Objects continue moving back and forth between S0 and S1 across multiple GC cycles. This process continues until either:
- The object becomes unreferenced (and is collected), or
- The object’s age reaches a specified limit known as the tenuring threshold.
Once the threshold is reached, and the object is still alive, it is promoted to the Old Generation — a section of the heap meant for long-lived objects.
Minor GC vs. Major GC
- Minor GC takes place in the Young Generation and usually runs quickly and often, since most objects in this region have a short lifespan.
- Major GC (also called Full GC) occurs in the Old Generation, where long-lived objects reside. It is less frequent but more time-consuming, as it deals with a larger memory space and performs more thorough cleanup.
Conclusion
Java’s memory management efficiently handles object allocation and cleanup through stack and heap memory, along with automated garbage collection. Understanding how objects move through Eden, Survivor spaces, and into the Old Generation—and the roles of Minor and Major GC—helps developers write more optimized and reliable applications.
What’s Next
Stay tuned for Part 2, where we’ll uncover how different garbage collectors work, when to use them, and how they manage memory over time.