Kibana Tool
Kibana is a dashboarding tool that works veritably nearly with Elasticsearch. Kibana is used for various use cases, like system monitoring & application observations. In a traditional monitoring system, we will monitor system performance, application logs, and so on.
Kibana core ships with the classics: histograms, line graphs, pie charts, sunbursts, and more. And, of course, we will search across all of our documents.
Kibana Benefits
- Interactive charts – You’ll be able to dynamically drag time windows, rivet and out of specific information subsets, and drill down on reports to extract unjust insights from your information
- Pre-built aggregations and filters – By Kibana’s pre-built aggregations and filters, we’ll be able to run a range of analytics like histograms, top-N queries, and trends with simply a couple of clicks.
- Simply accessible dashboards- We will simply originate dashboards and reports and share them with others. All we’d like maybe a browser to look at and explore the information.
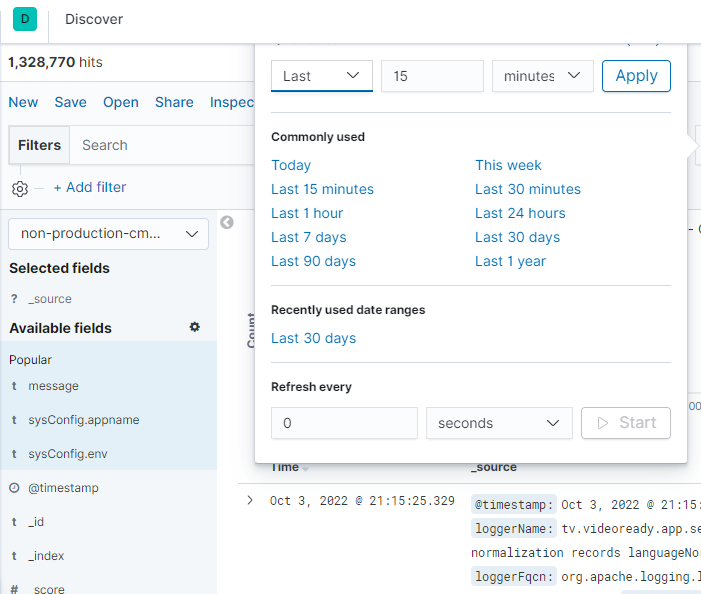
Applying filters on Kibana
- Use Search:- To perform ad hoc searches for specific text, use the search bar.
- Select Environment from Dropdown:- Select the environment/project from the dropdown, for which you want to get the data/logs
- Specify Date & Time:- Select the range of period for which you want to extract the records
- Hit the refresh button:- Click on the refresh button in case you want to get the updated logs