Stunning fusion charts will wow your audience . You can download javascript files for free trail of fusion chart from here .
Following Javascript files are required to create fusion charts :
[js]
<script src="../js/jquery.min.js"></script>
<script src="../js/FusionCharts.js"></script>
<script src="../js/FusionCharts.HC.js"></script>
<script src="../js/FusionCharts.HC.Charts.js"></script>
<script src="../js/FusionCharts.jqueryplugin.js"></script>
<script src="../js/FusionChartsExportComponent.js"></script>
[/js]
Let us take a small example to demonstrate how it works:
[js]
<%@ page contentType="text/html;charset=UTF-8" %>
<html>
<head>
<title>Fusion chart</title>
<script src="../js/jquery.min.js"></script>
<script src="../js/FusionCharts.js"></script>
<script src="../js/FusionCharts.HC.js"></script>
<script src="../js/FusionCharts.HC.Charts.js"></script>
<script src="../js/FusionCharts.jqueryplugin.js"></script>
<script src="../js/FusionChartsExportComponent.js"></script>
</head>
<body>
<div id="chartDisplaydiv"></div>
<script>
$(document).ready(function(){
$("#chartDisplaydiv").insertFusionCharts({
swfUrl: "Pie3D",
dataSource: ‘../demo/jsonData’,
renderer: ‘JavaScript’,
dataFormat: "jsonUrl",
width: "1000",
height: "600",
id: "revenueChart"
});
});
</script>
</body>
</html>
[/js]
In the code above on the jQuery document ready event fusion chart is inserted inside the div whose id is “chartDisplaydiv” . Inside insertFusionCharts method we need to specify the value for following parameters:
[js]
swfUrl : "Type of chart you want to generate"
dataSource : "from where you get data in the form of json or xml"
dataFormat : "In this example we are having a json response at ../demo/jsonData so we have specified value jsonUrl"
width : "Width of the chart"
height : "Height of the chart"
id : "id of the chart"
[/js]
Json response we are getting for this chart at ../demo/jsonData :
[js]
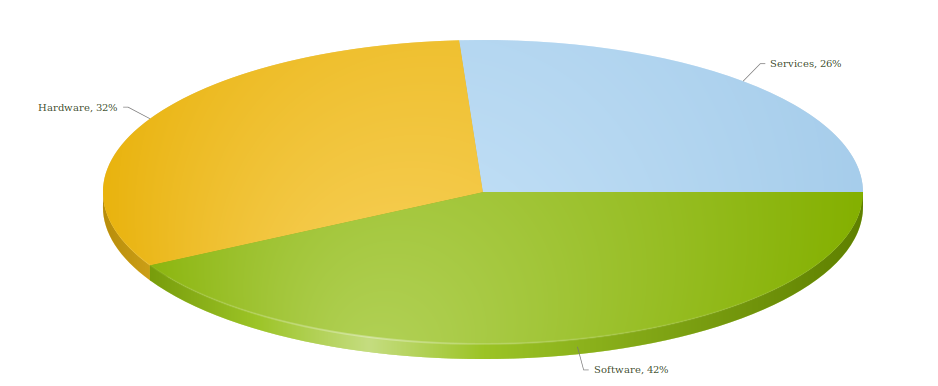
{ "chart":{ "caption":"Company Revenue", "showpercentvalues":"1" }, "data":[{ "label":"Services", "Value":"26" }, { "label":"Hardware", "Value":"32" }, { "label":"Software", "Value":"42" } ] }
[/js]
Chart generated will look like this: